Real Chart Replays · 2026-09-30
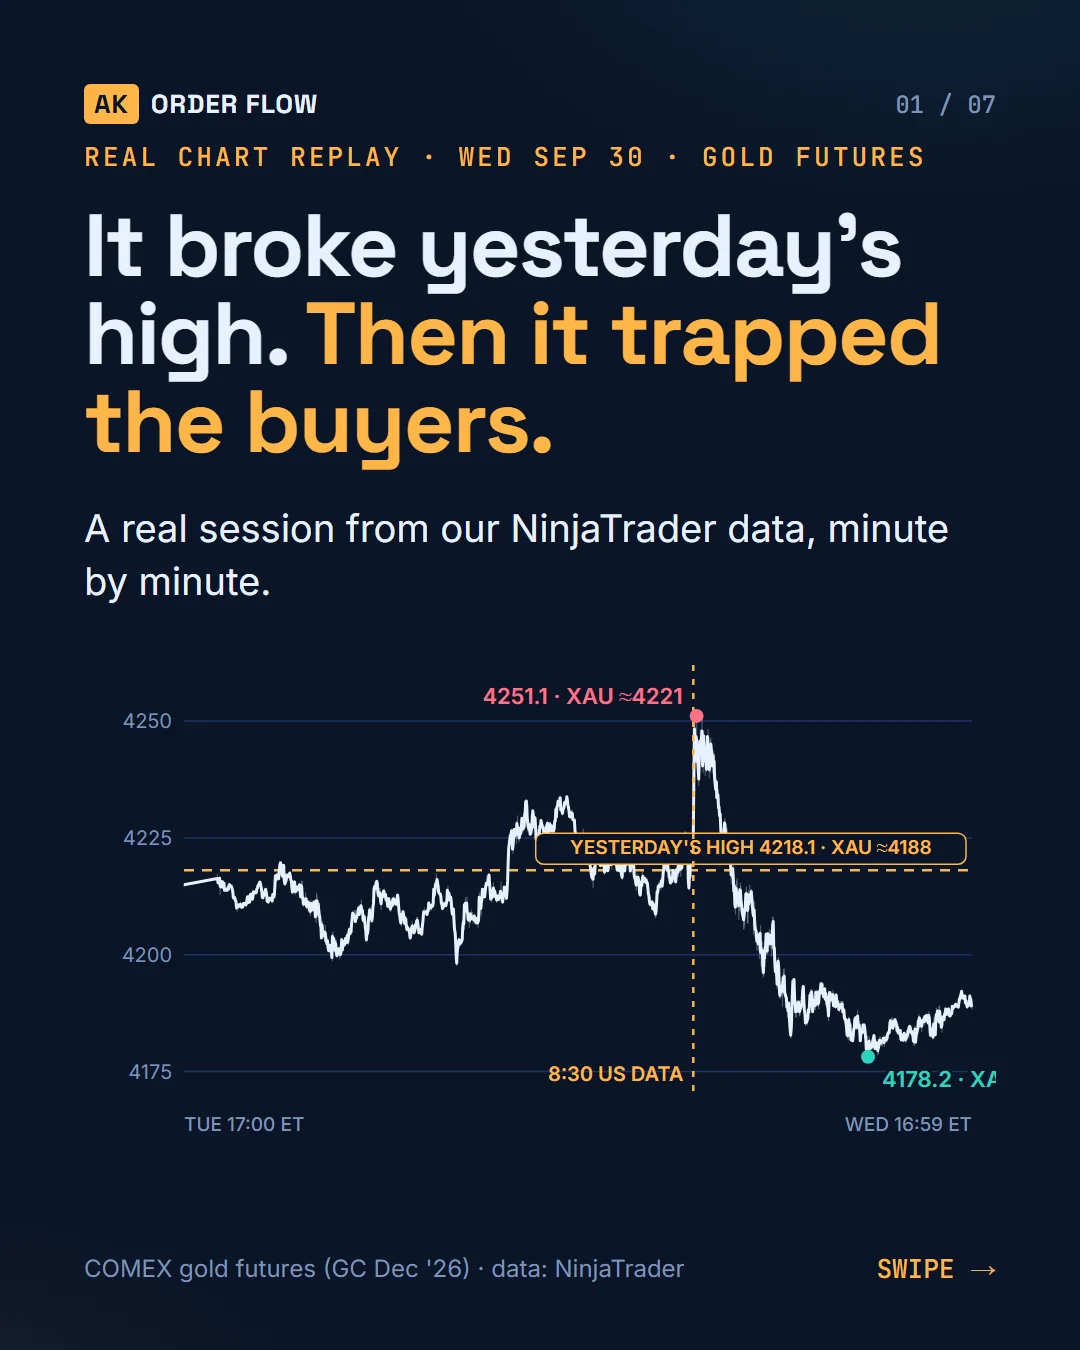
Real Chart Replay: Gold broke yesterday's high, then trapped the buyers (Sep 30)
Real Chart Replay: it broke yesterday's high… then trapped the buyers 🪤
Sep 30, gold futures (GC), from our NinjaTrader data (XAUUSD ≈ in brackets):
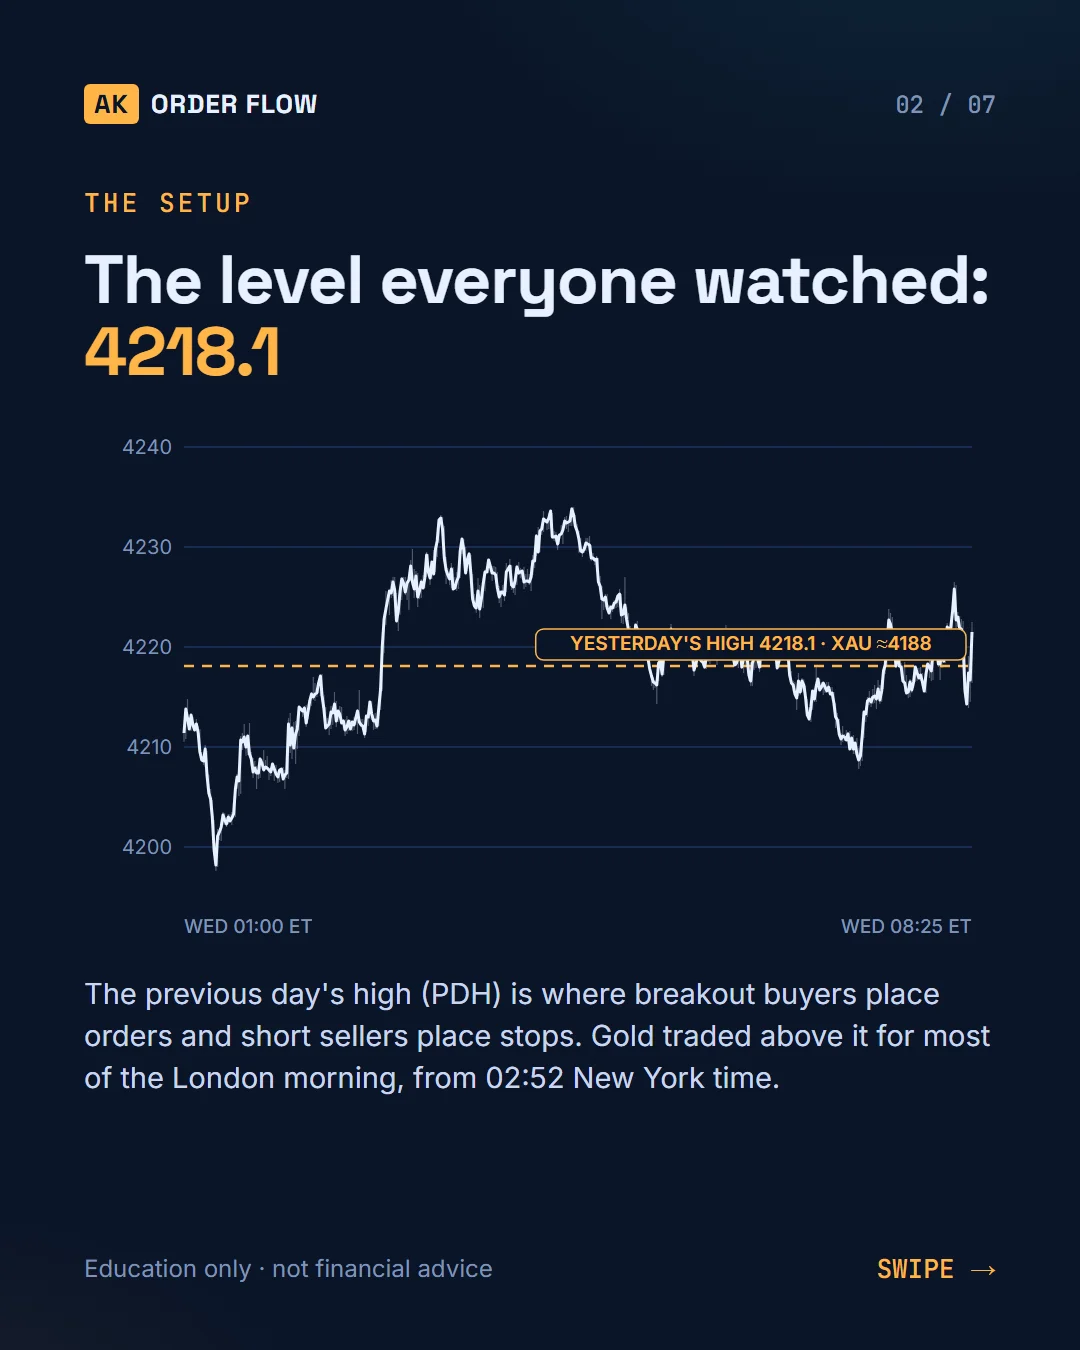
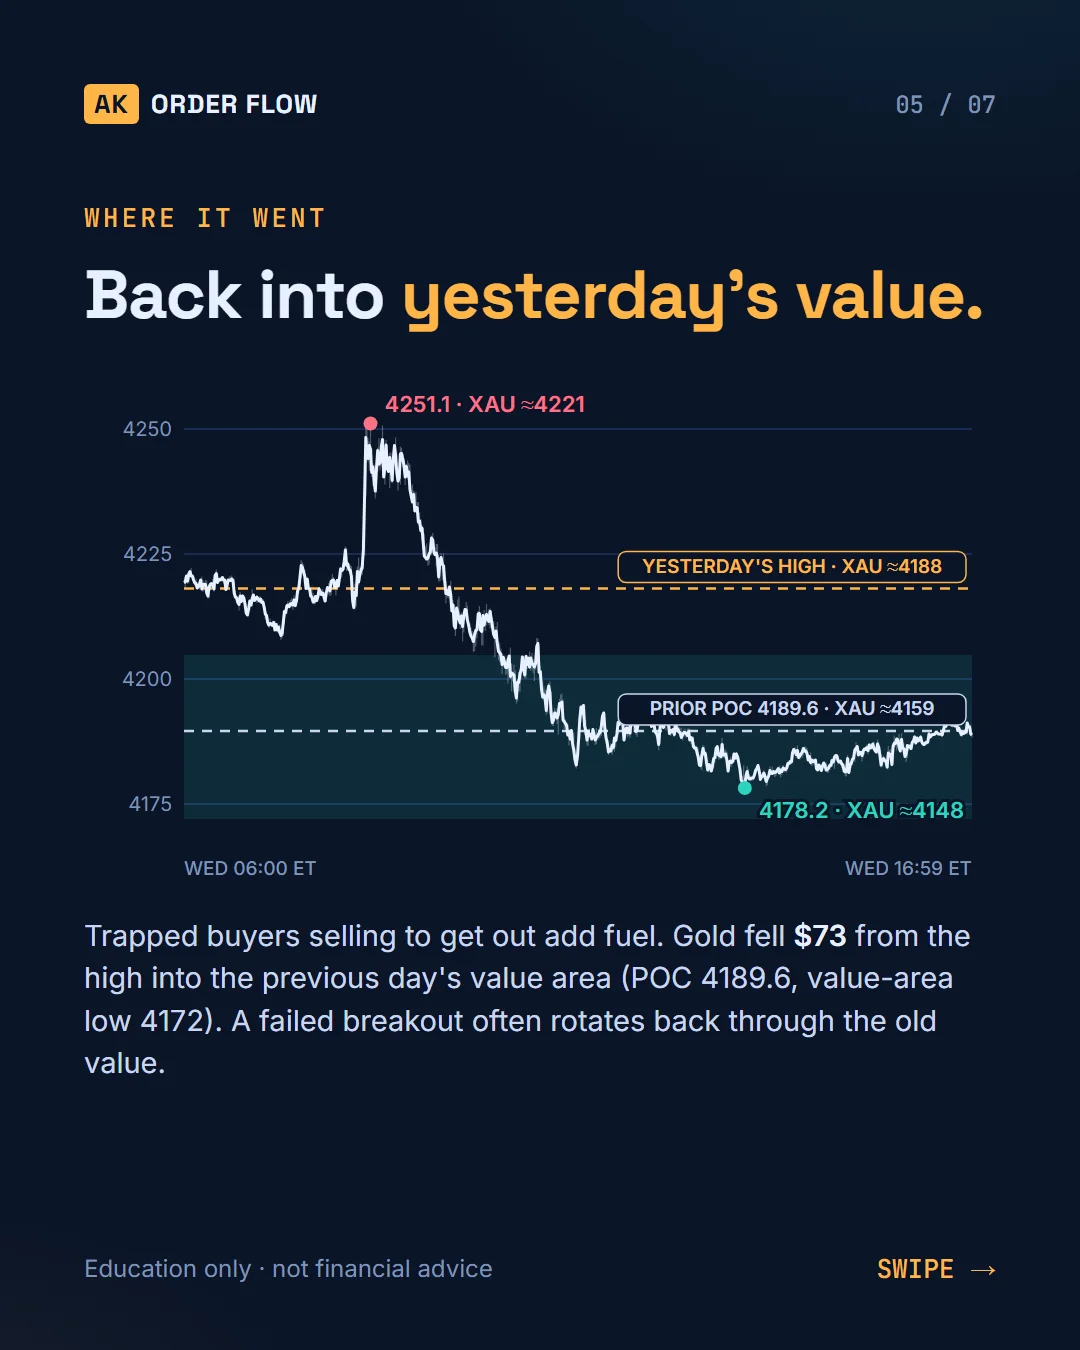
1️⃣ Held above yesterday's high 4218.1 (≈4188) all London morning
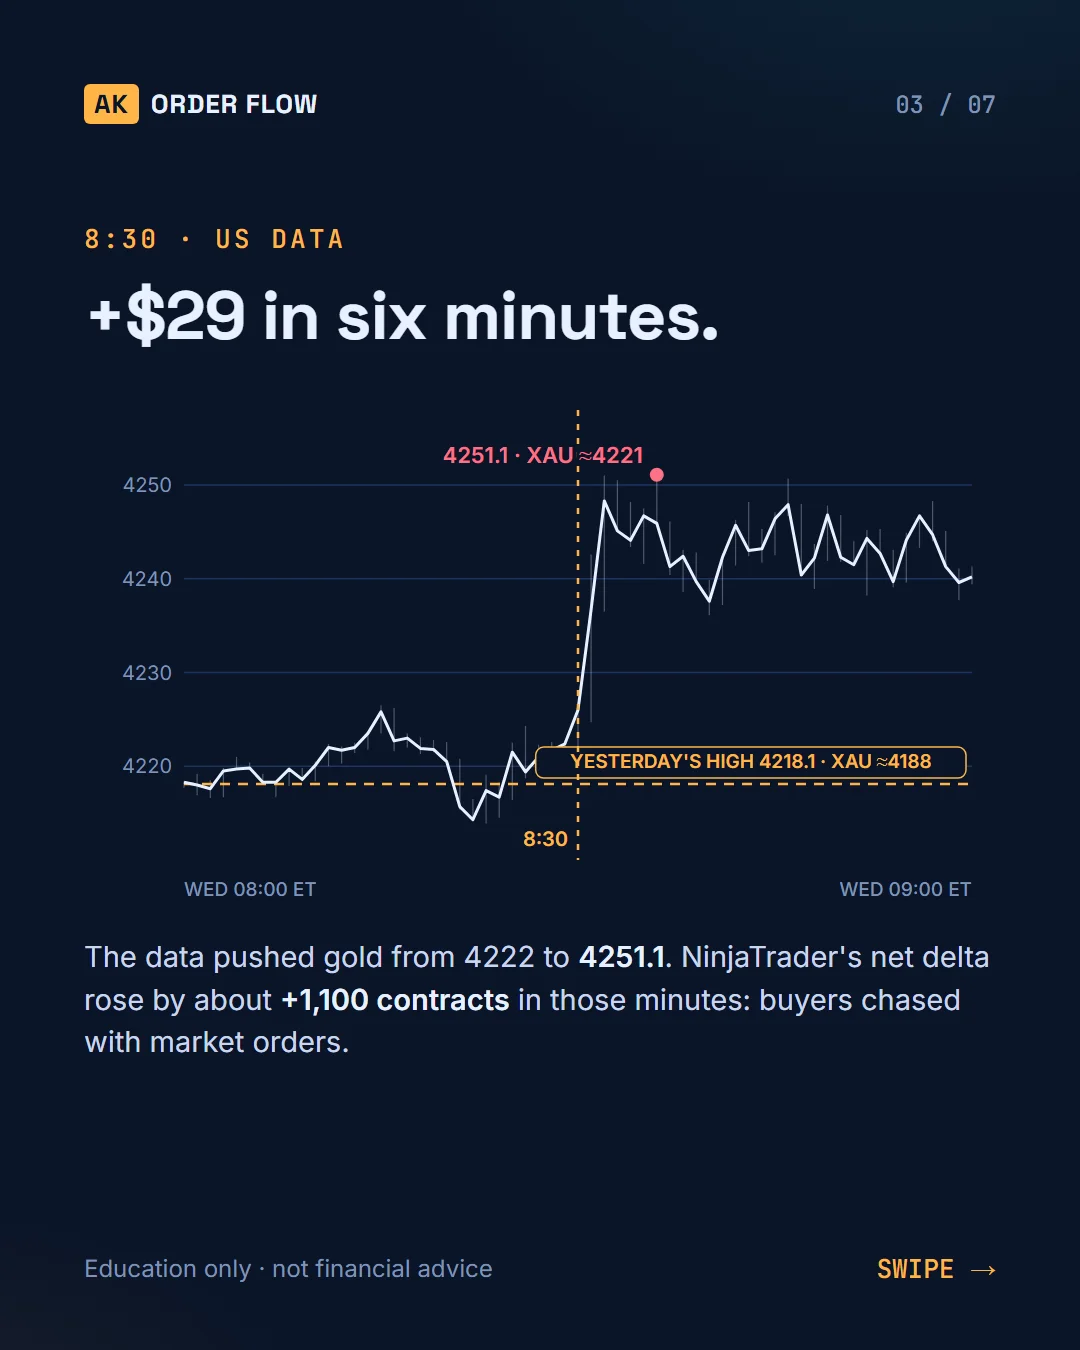
2️⃣ 8:30 US data: +$29 in six minutes to 4251.1 (≈4221)
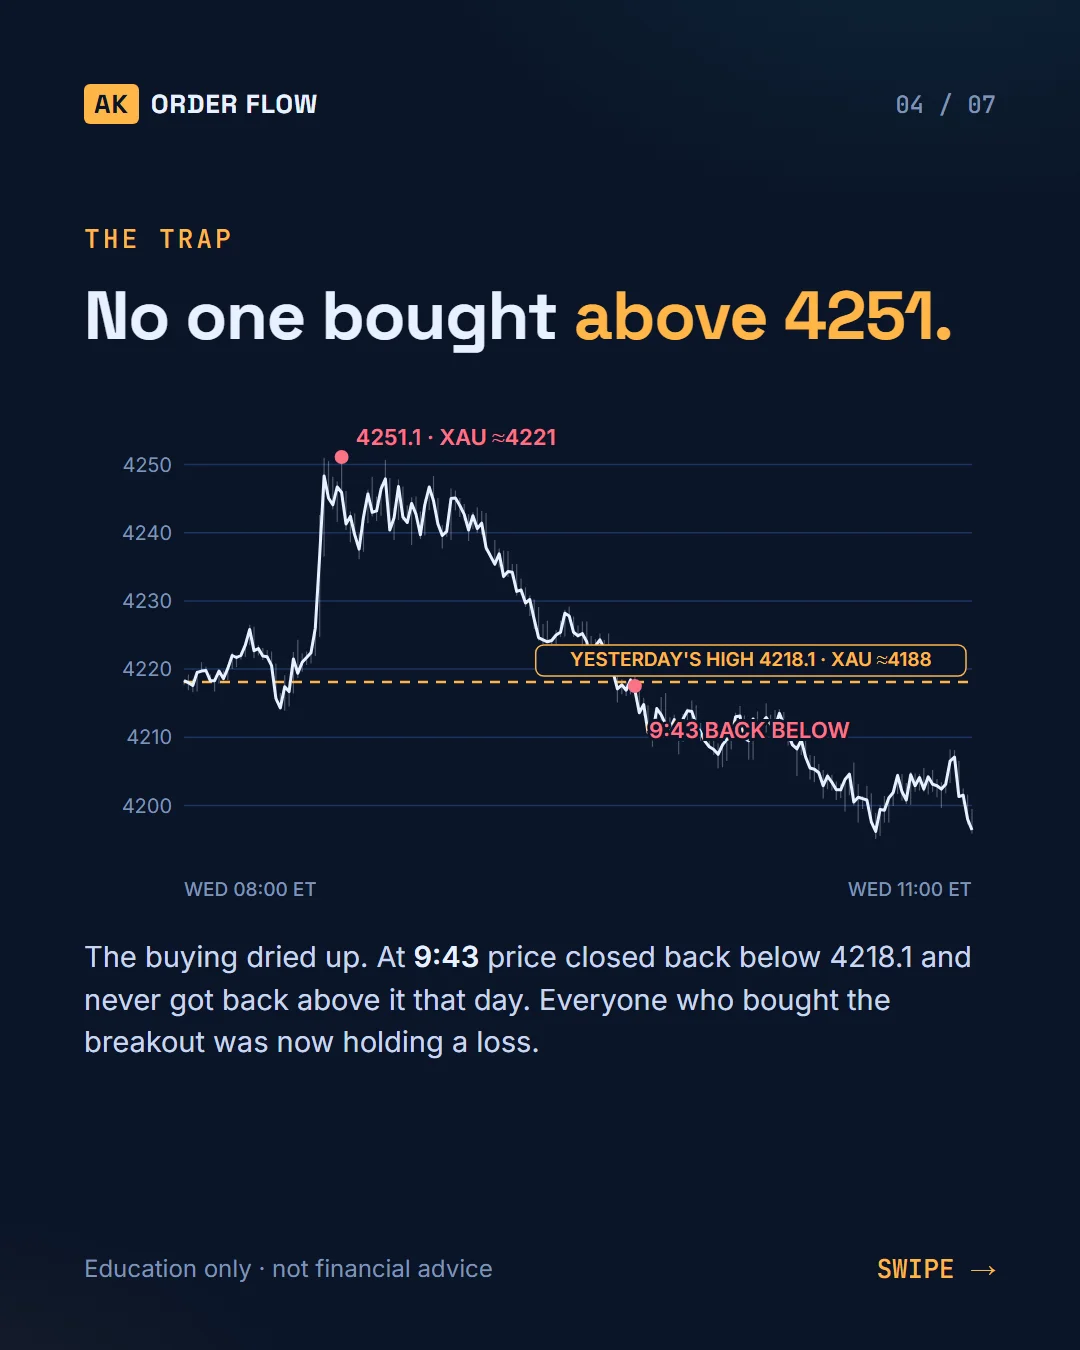
3️⃣ No buyers above it. 9:43: back below 4218.1 for good
4️⃣ Trapped buyers sold: −$73 to 4178.2 (≈4148), into yesterday's value
Three checks to tell a breakout from a trap:
- Is time and volume building above the level?
- Does aggressive buying follow through to new highs?
- Back inside the level = the old value area is the next reference
Reading skills, not trade signals.
XAUUSD ≈ = futures level + that day's gap (about −30).