Lesson 06 · 2026-10-09
Contract Months, Rollover & Continuous Charts
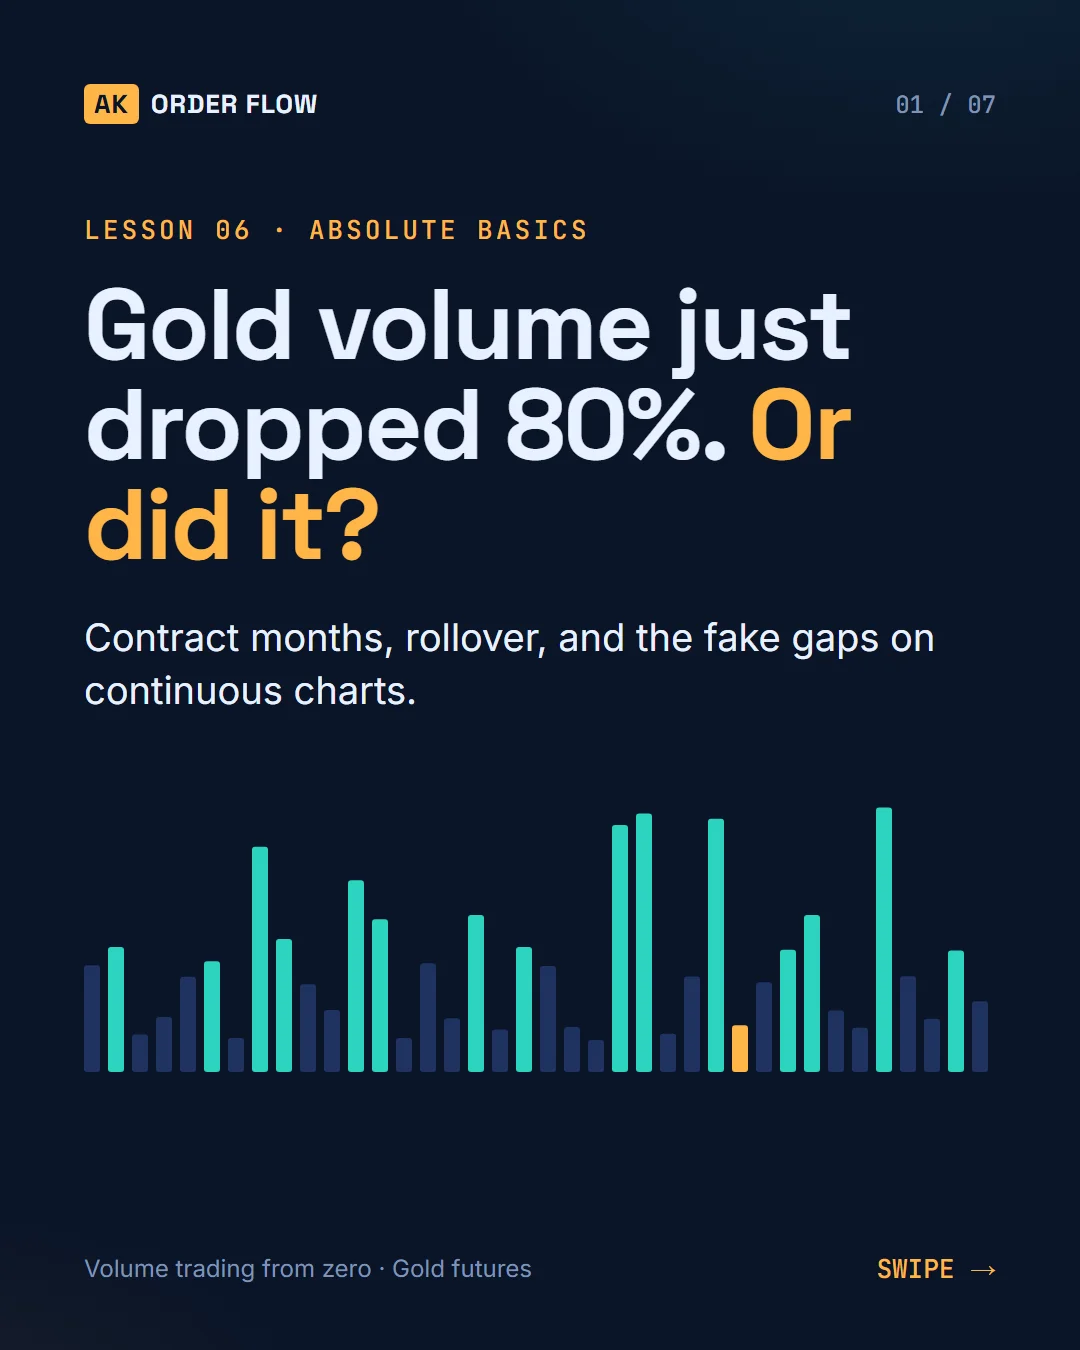
Gold volume just dropped 80%. Panic? No — everyone moved to next month.
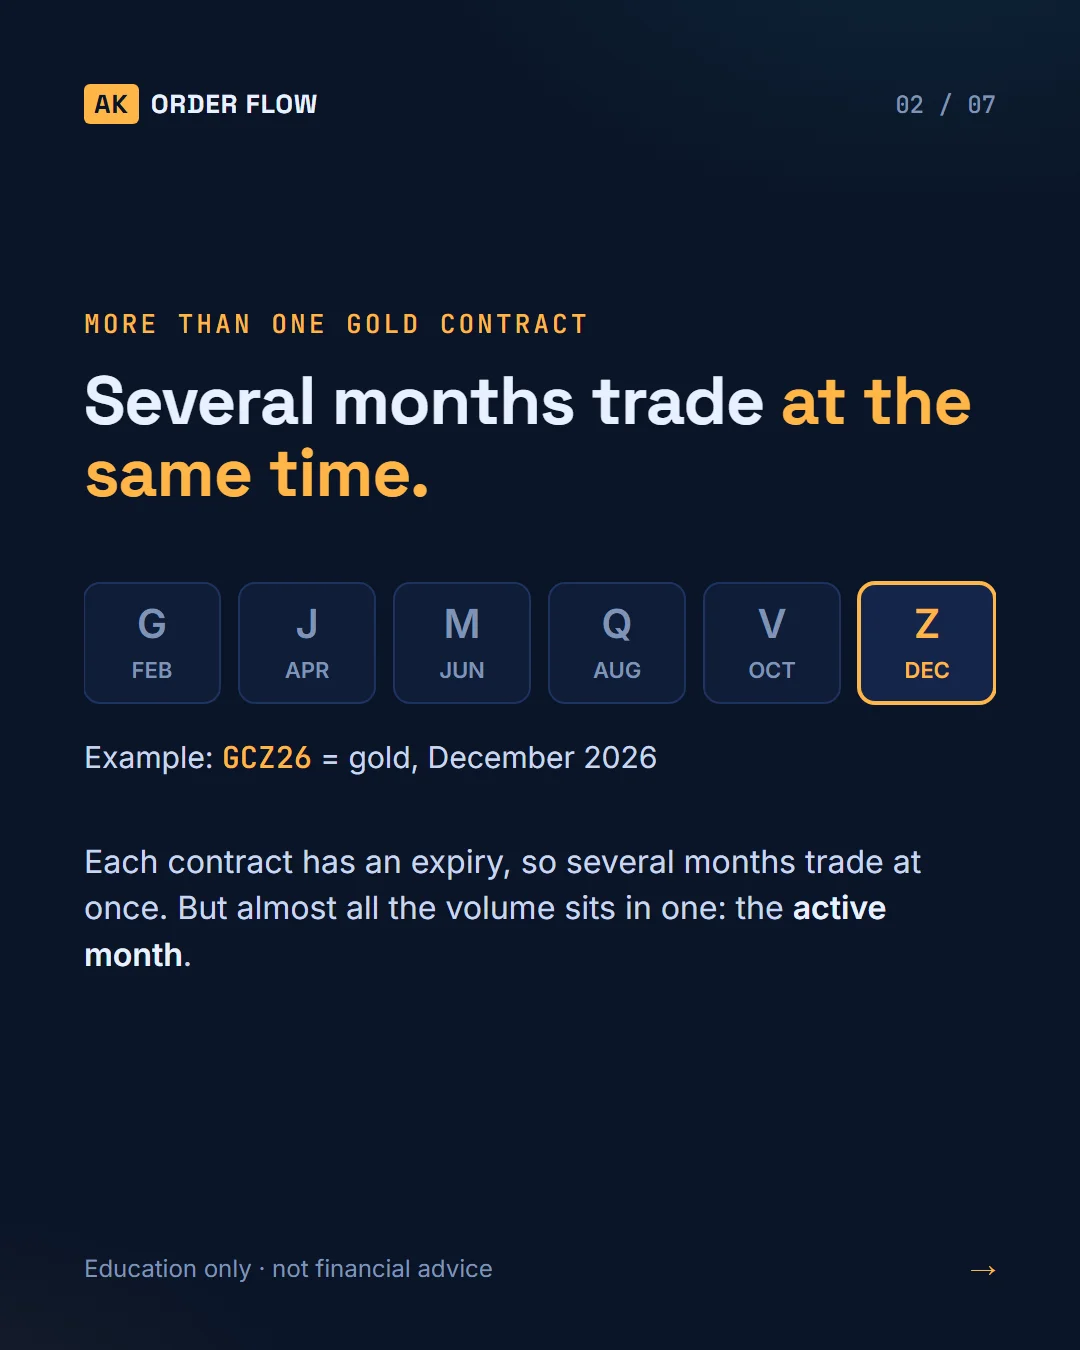
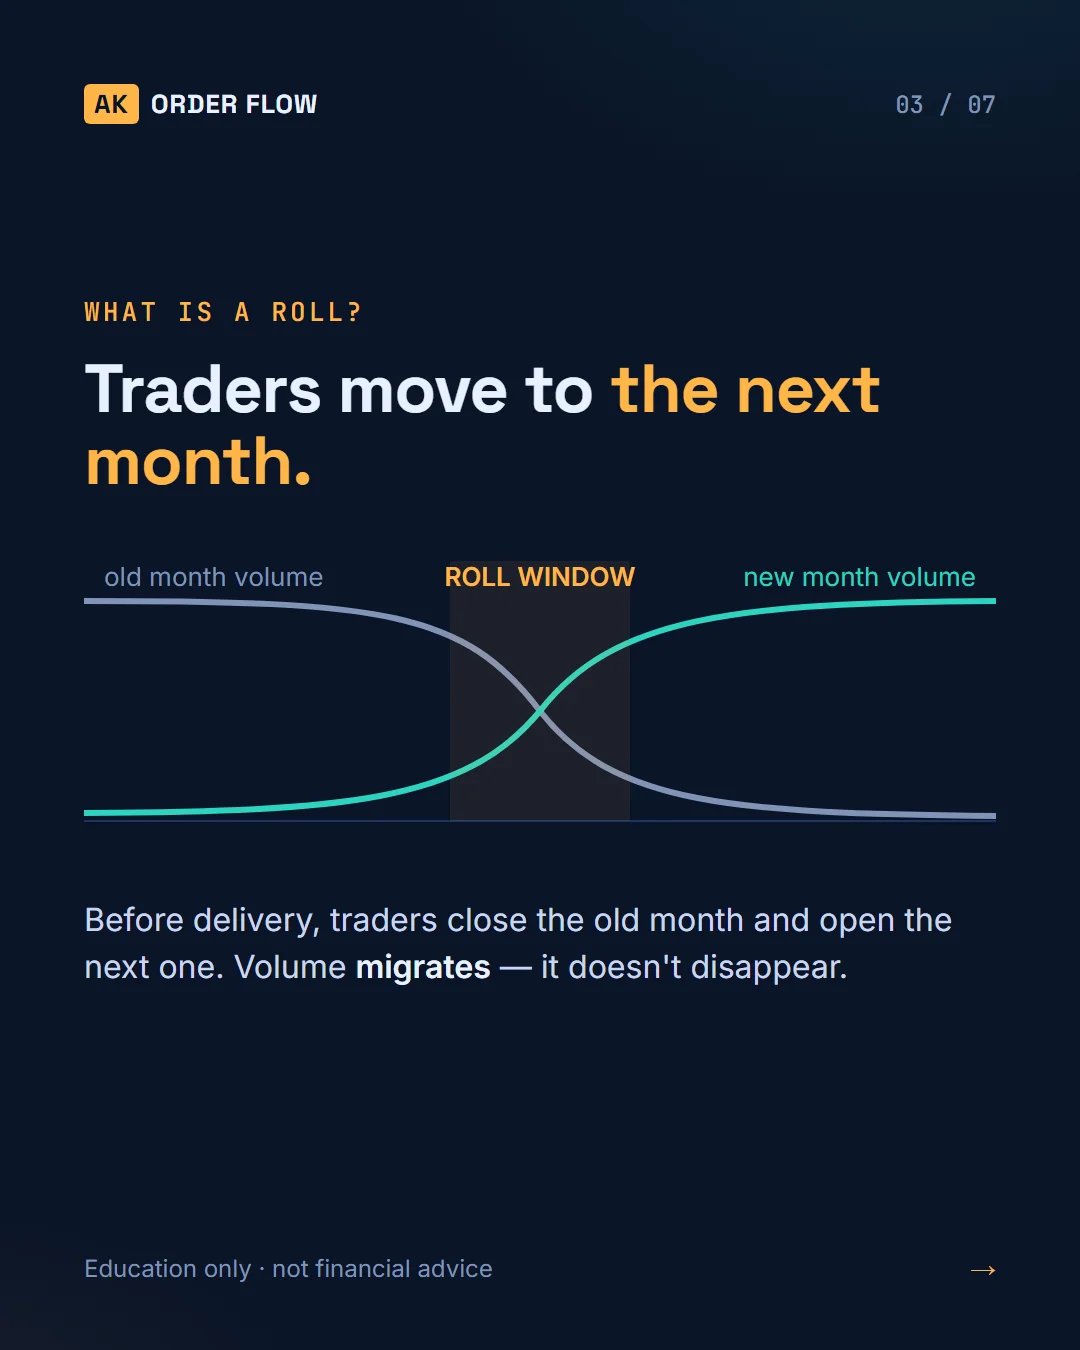
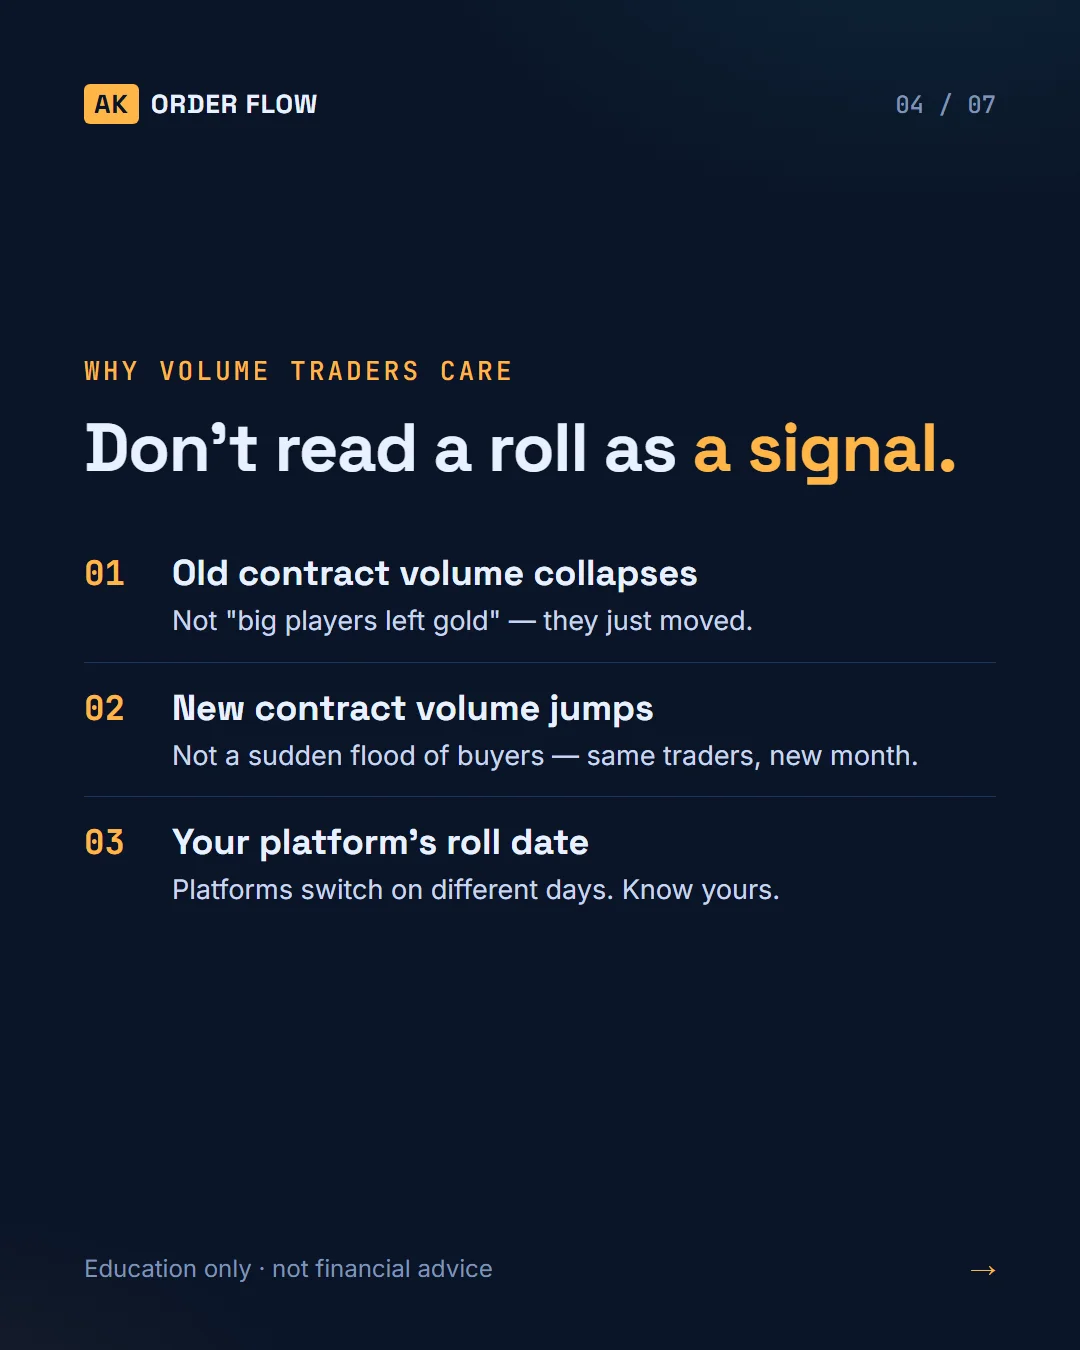
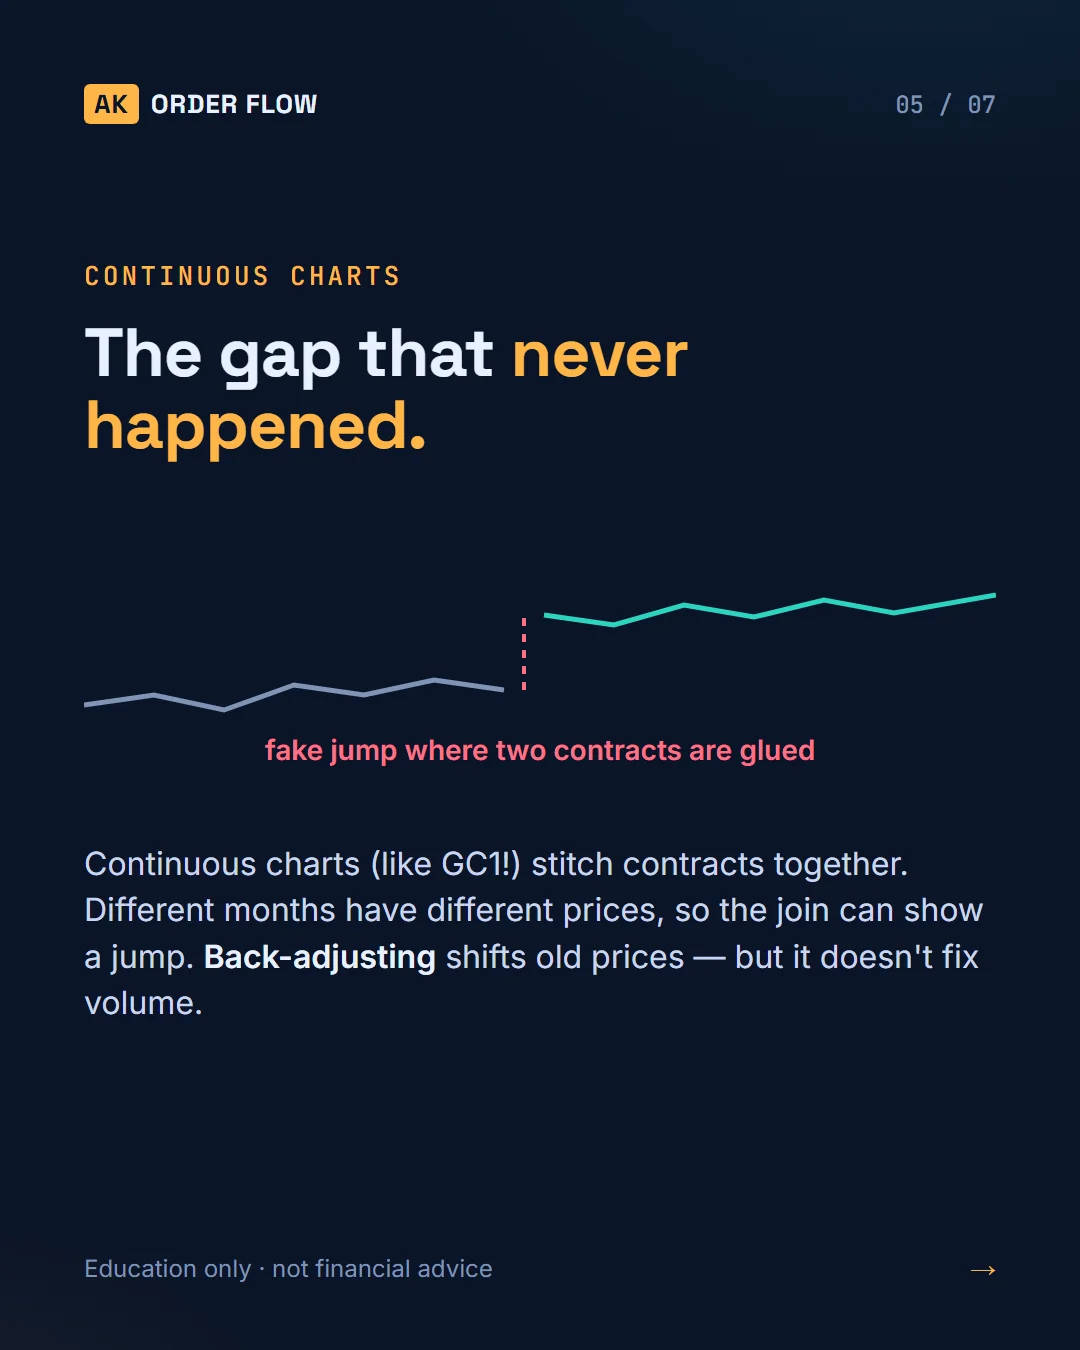
Gold futures trade in several contract months at once (G J M Q V Z), but almost all volume sits in the active month. Before delivery, traders roll to the next one, so volume migrates — it doesn't disappear. Continuous charts glue contracts together and can show jumps that never happened.
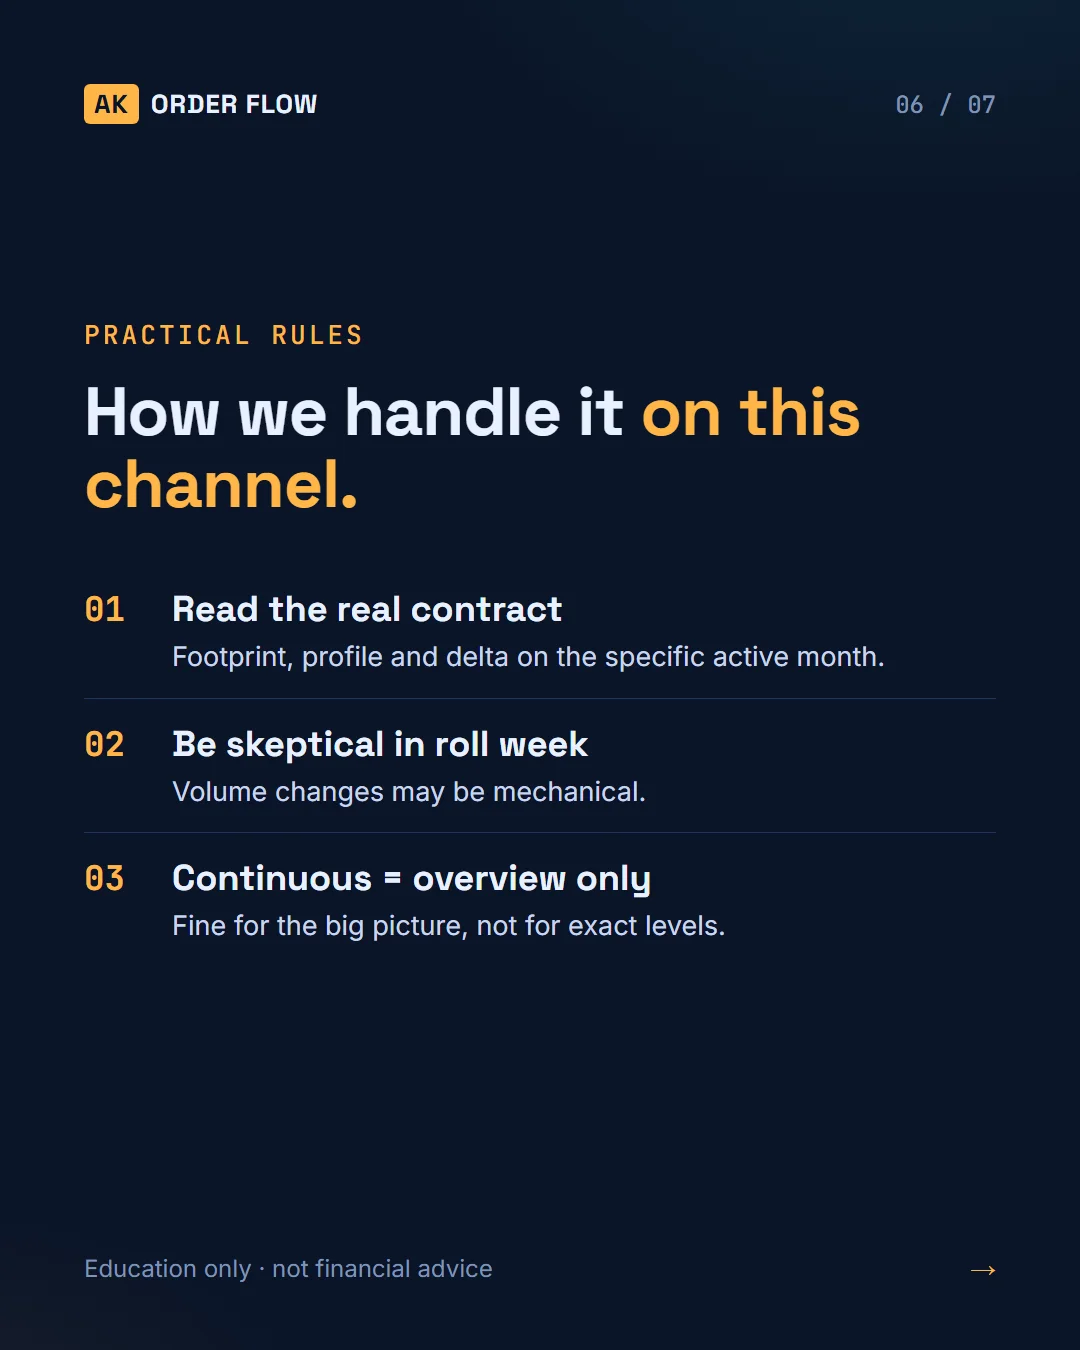
Our rule: read footprint, profile and delta on the real active contract, and be skeptical of volume changes in roll week.