The whole order-flow system on one chart
AK FlowBook turns a NinjaTrader 8 chart into one order-flow workspace. On a single 1-minute chart you see where the market did its business (profile levels, VWAPs, session highs and lows), what aggressive traders did on every candle (delta, candle volume filters, big trades, single large orders, event labels), what passive traders were doing (icebergs and the MBO Price Map, order by order) and the context that decides how all of it reads (the market context panel and the info line). The toolbar switches each layer on or off, so you can go from the full picture to a clean trading view in one click. Nothing on the chart is a signal. Each layer describes what traded, what rests in the book and where price is against the levels you already watch.
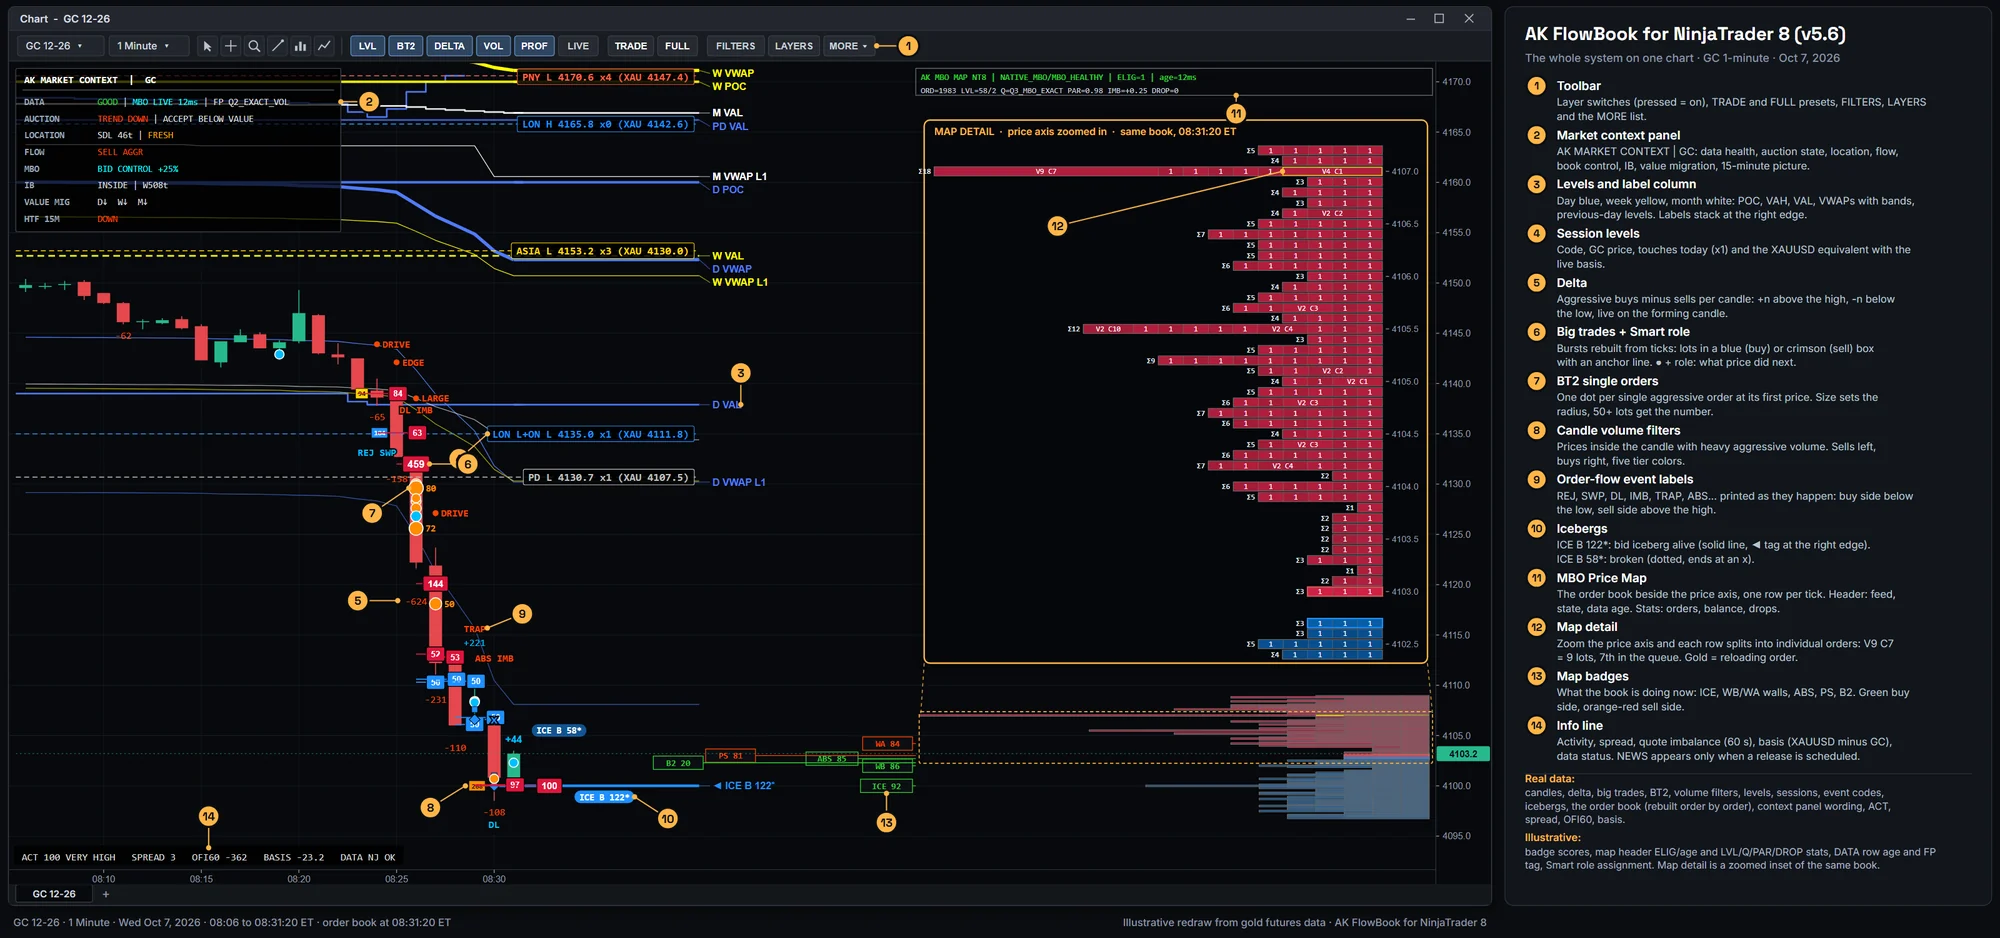
Illustrative redraw from gold futures data, Oct 7 2026, 08:06 to 08:31 ET. Numbers match the sections below.
Join the waitlist Read the full documentation
MBO Price Map
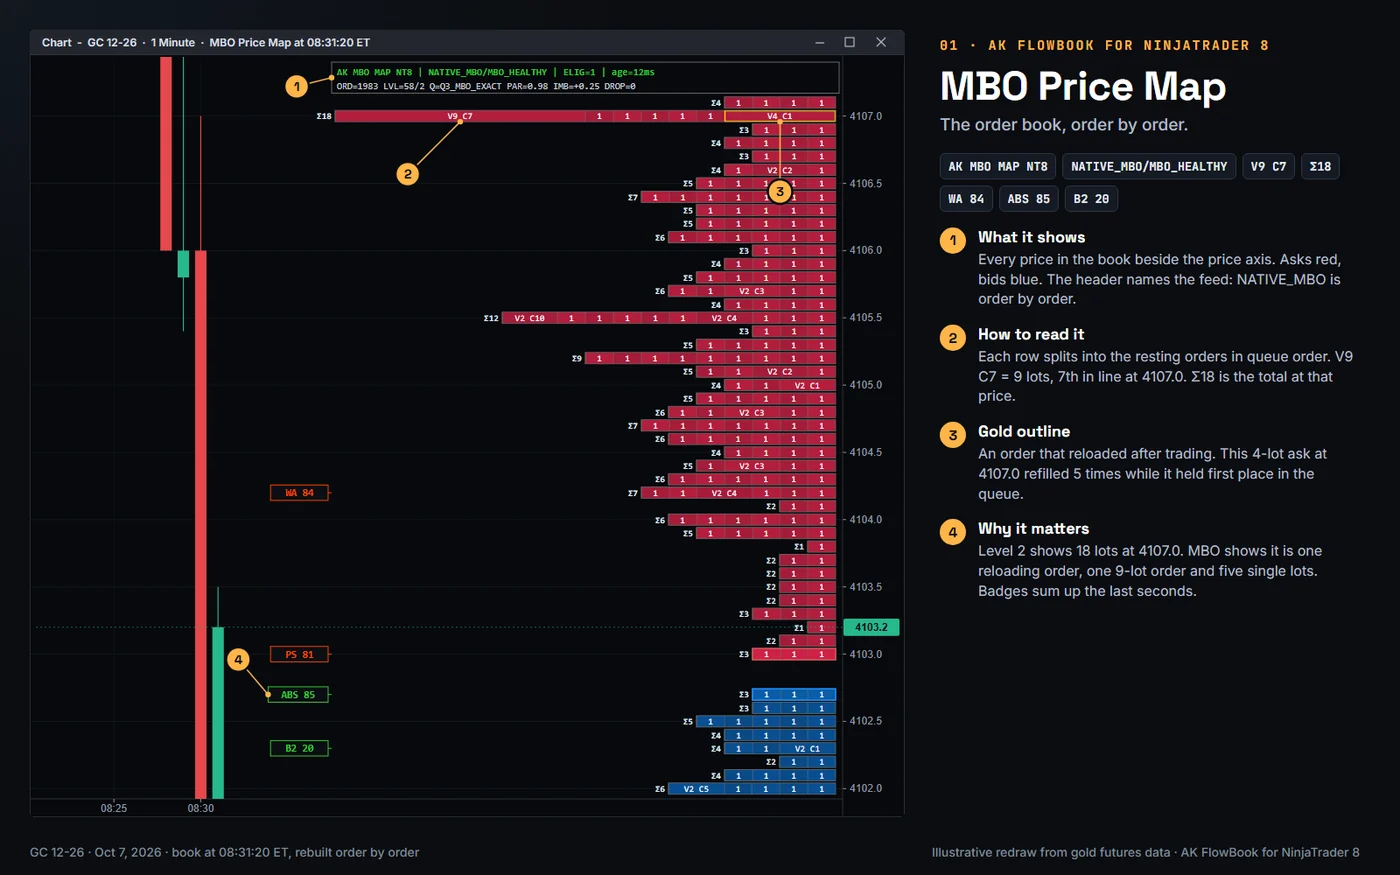
The MBO Price Map draws the order book on the right side of the chart, one row per price, lined up with the price axis. Asks are red, bids are blue, the best bid and ask are outlined. With market-by-order data from a Rithmic connection, each row splits into the individual resting orders in queue order. V9 C7 means one order of 9 lots, seventh in line at its price, and Σ18 is the total. At 4107.0 Level 2 shows 18 lots; the map shows one 4-lot order outlined in gold because it reloaded five times, one 9-lot order and five single lots. The header (AK MBO MAP NT8 | NATIVE_MBO/MBO_HEALTHY | ELIG=1 | age=12ms) tells you the feed and its health, and badges such as ICE, WB, WA, ABS, PS and B2 sum up what the book did in the last seconds.
Delta
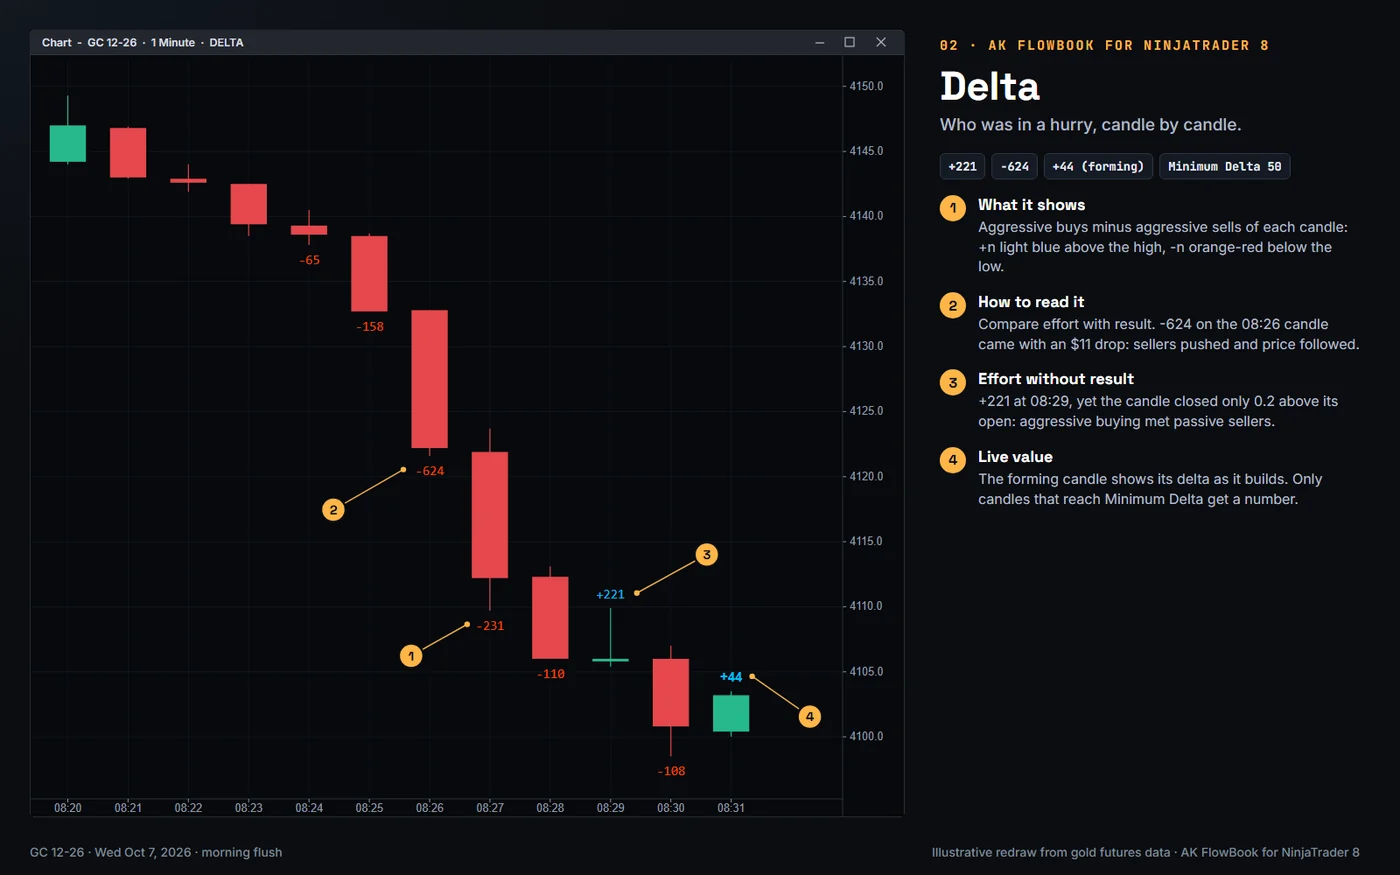
Delta is the aggressive buy volume minus the aggressive sell volume of one candle. AK FlowBook prints it as +n in light blue above the candle high and -n in orange-red below the low, and shows the live value on the forming candle. Only candles that reach Minimum Delta (50 lots on GC by default) get a number, so the chart stays readable. Read delta as effort and the candle as result. At 08:26 delta was -624 and the candle fell $10.6: sellers pushed and price followed. At 08:29 delta was +221, yet the candle closed only 0.2 above its open: aggressive buyers met passive sellers. The same number means different things depending on what price did with it.
Big trades, Smart roles and BT2
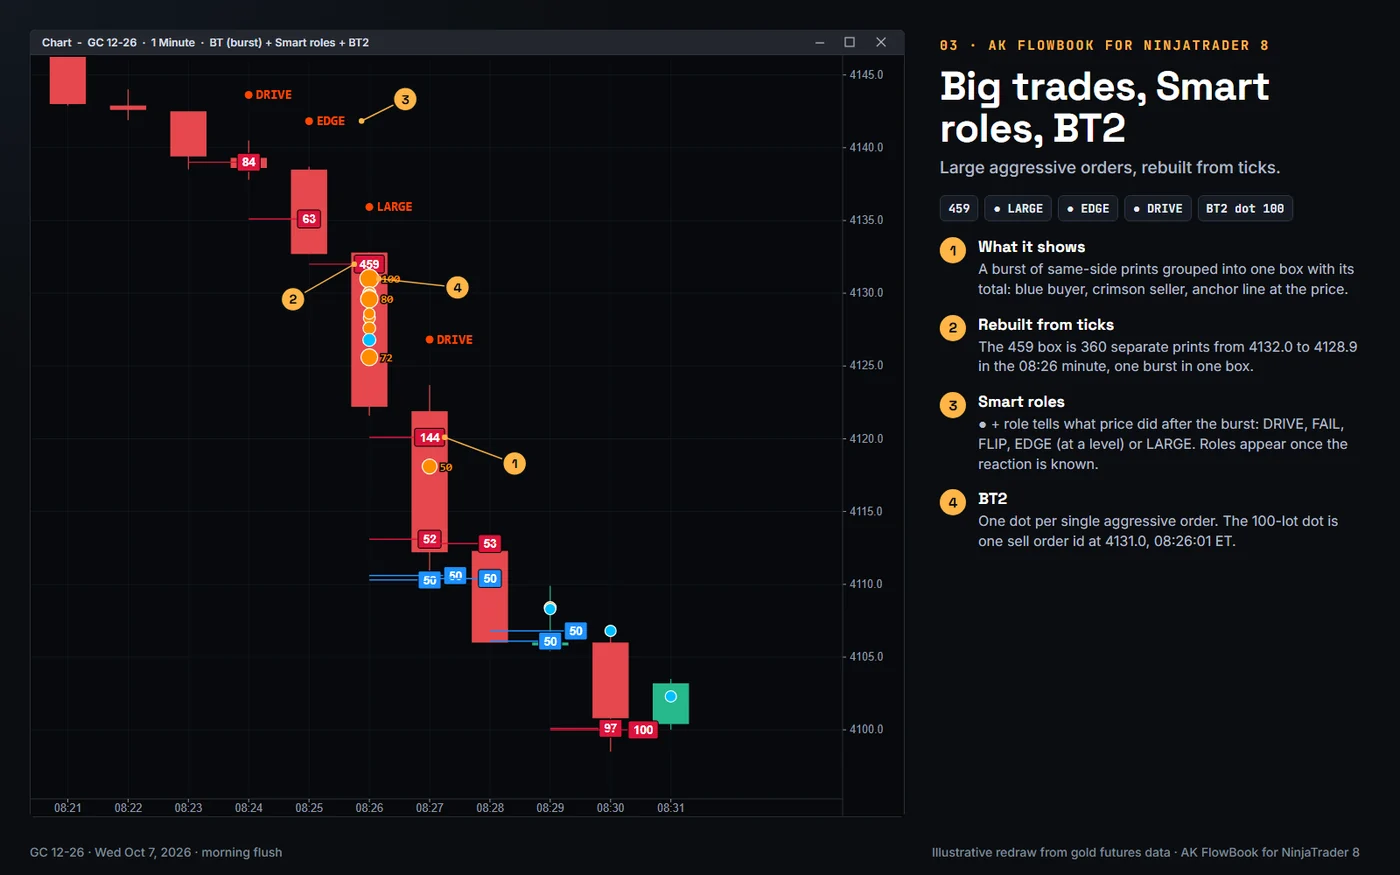
A large aggressive order rarely prints as one trade. It fills against many resting orders and the tape shows a burst of small prints. AK FlowBook rebuilds those bursts from tick data and draws each one as a box with its total size: DodgerBlue for an aggressive buyer, crimson for an aggressive seller, with a short anchor line at the price. In the 08:26 minute the 459 box is 360 separate prints from 4132.0 to 4128.9, grouped into one burst. Smart roles add what happened next: a ● and DRIVE, FAIL, FLIP, EDGE (at an important level) or LARGE. BT2 marks single aggressive orders, one order id each, as dots that grow with size, with the lot count from 50 lots. Together they show who traded size, where, and what price did after it.
Icebergs
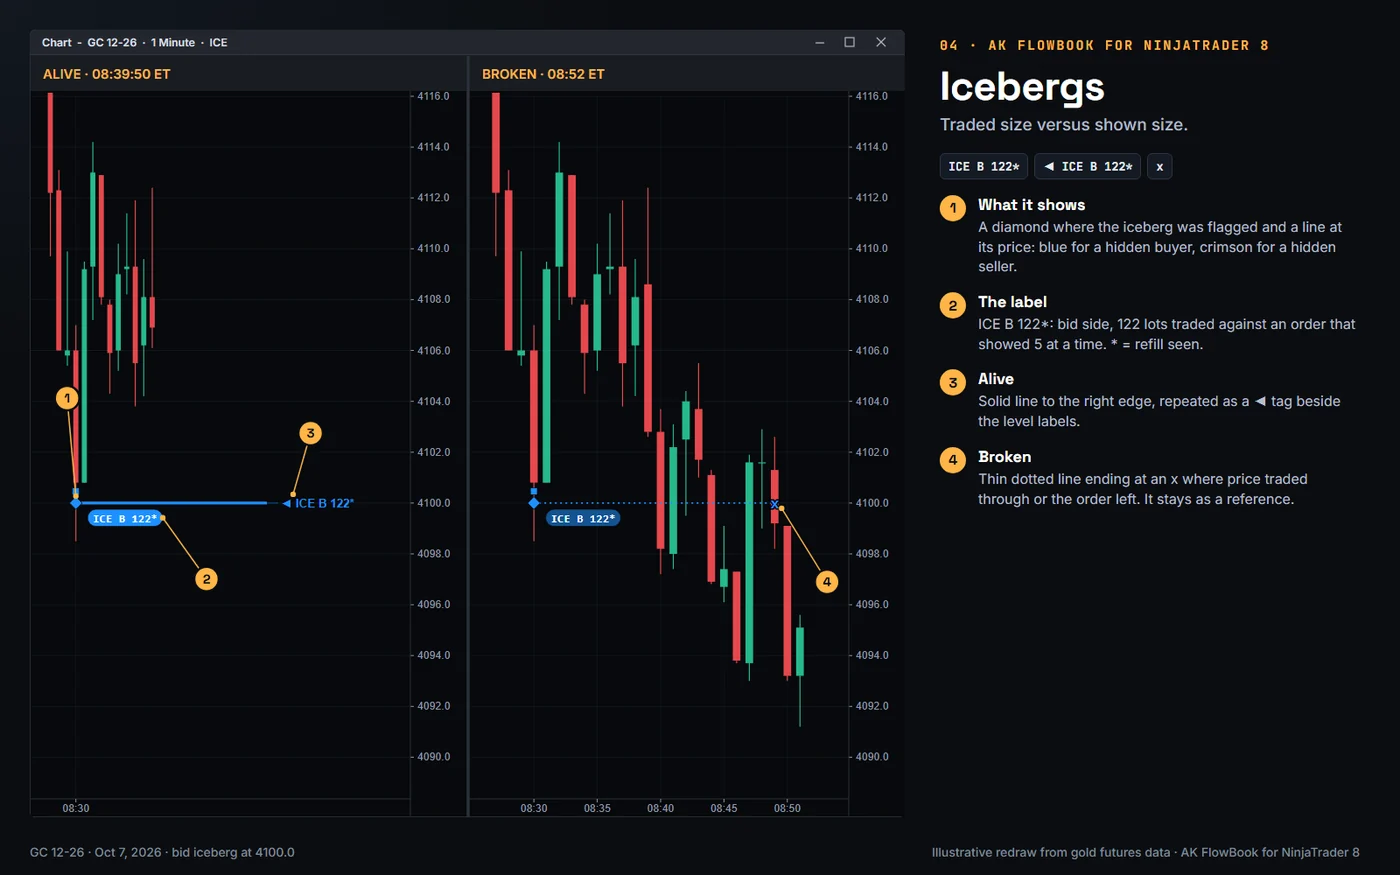
An iceberg is a resting order that shows only part of its size. Each time the visible part trades, it refills. AK FlowBook reads the book order by order and compares traded size with shown size. At 4100.0, 122 lots traded against a bid that showed 5 lots at a time. The chart marks it with a diamond where it was flagged, a blue line at the price (crimson for a hidden seller) and the label ICE B 122*: bid side, lots traded, * = refill seen. While the iceberg is alive the line is solid to the right edge and repeated as a ◄ ICE B 122* tag beside the level labels. Once price trades through or the order leaves, the line turns thin and dotted and ends at an x. Icebergs need market-by-order data through Rithmic.
Volume profile levels and naked levels
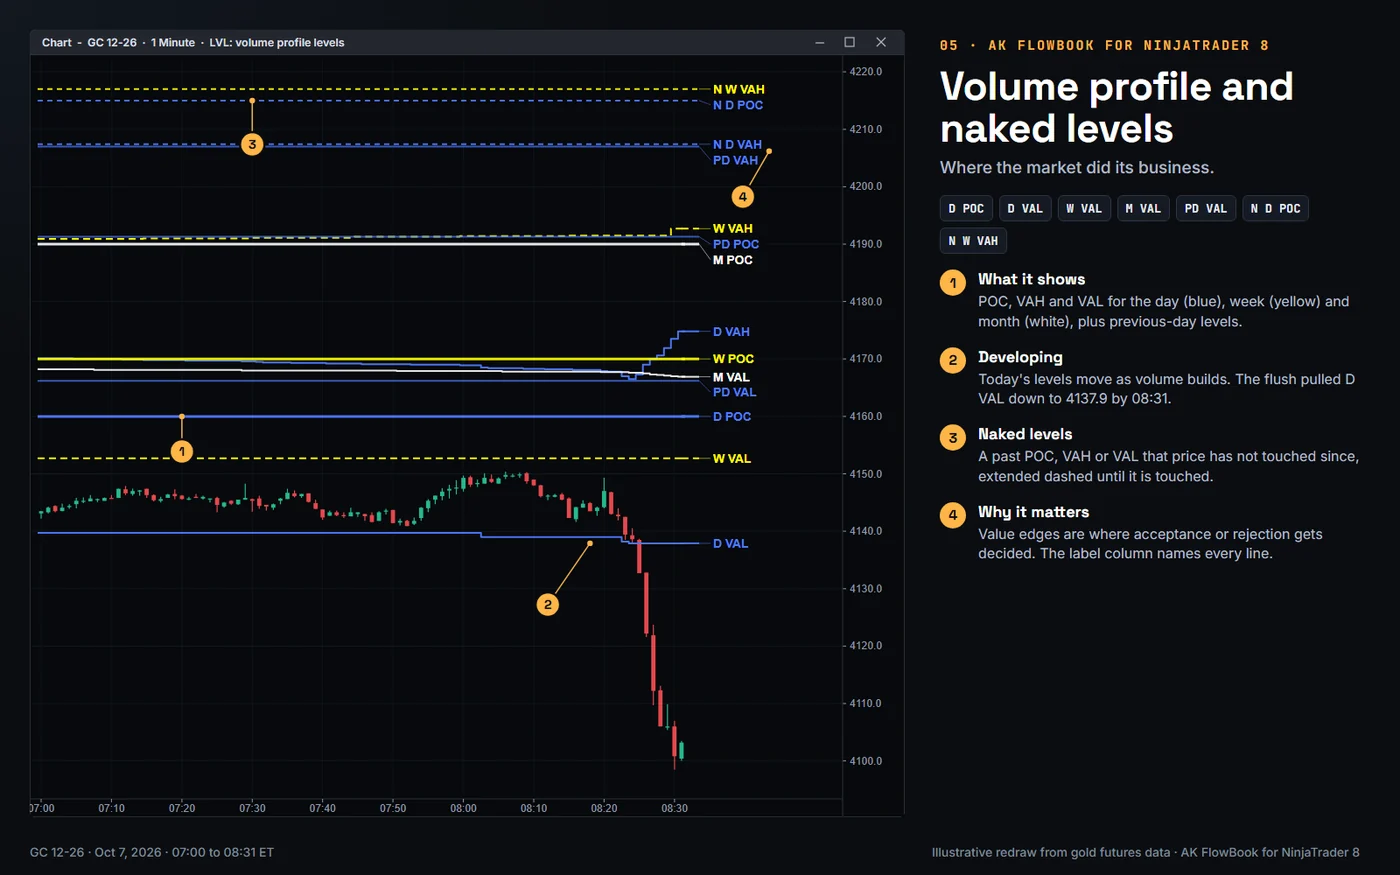
The LVL layer draws where the market did most of its business, computed from traded volume. POC is the price with the most volume, VAH and VAL are the top and bottom of the value area. AK FlowBook draws them for the day (blue), the week (yellow) and the month (white), plus the previous day (PD POC, PD VAH, PD VAL) and two days ago (P2D). Today's levels develop as volume builds: on October 7 the flush pulled the daily VAL down to 4137.9 by 08:31. Naked levels are past POCs, VAHs and VALs that price has not touched since; they extend as dashed lines labeled N D POC, N W VAH and so on until price reaches them. Labels stack in a column at the right edge, merged when levels share a price.
VWAPs and bands
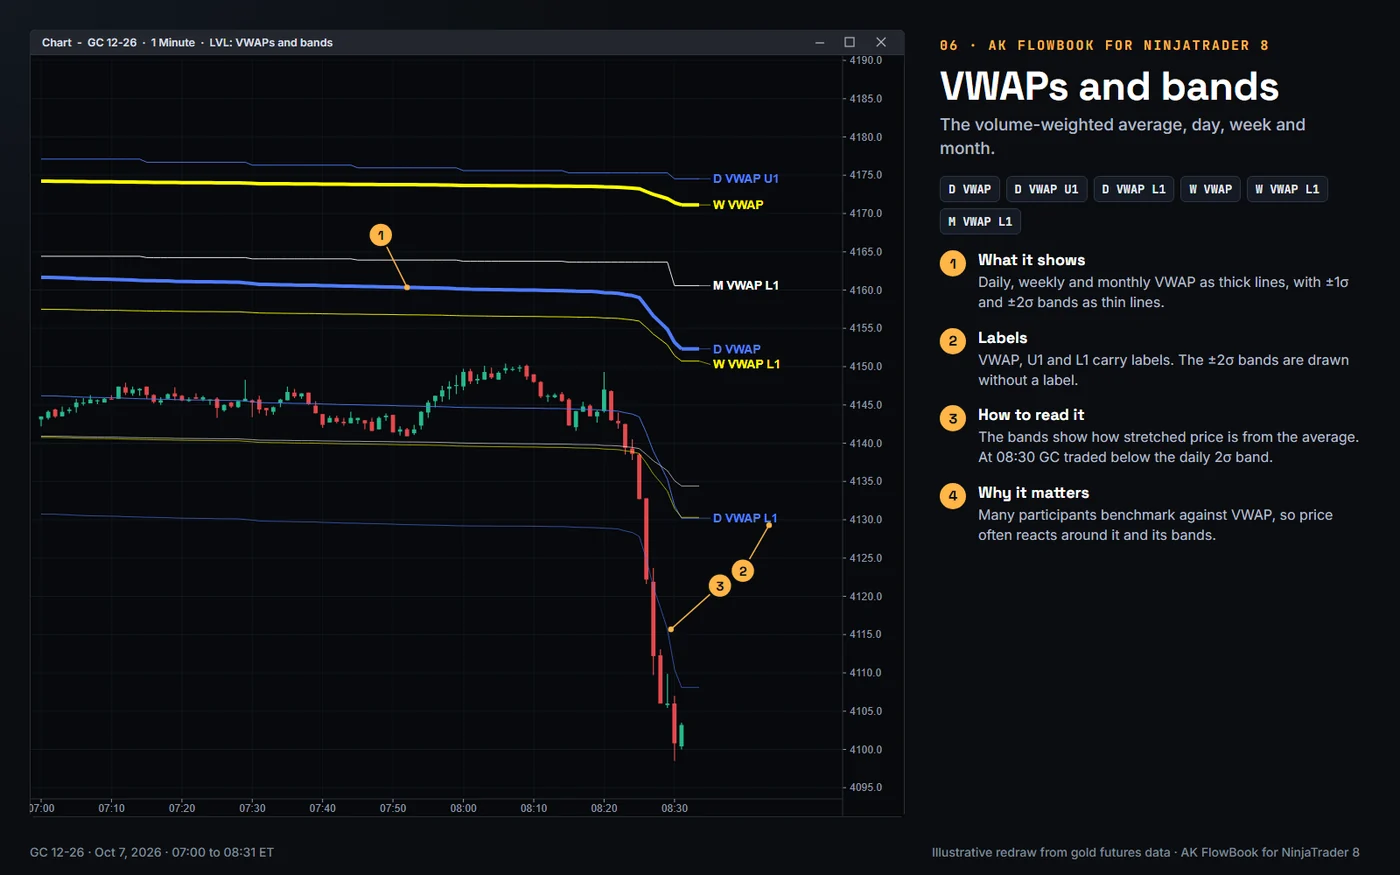
VWAP is the average price of a period weighted by the volume traded at each price. AK FlowBook draws the daily, weekly and monthly VWAP as thick lines in the timeframe color, with ±1σ and ±2σ bands as thin lines. The label column names each VWAP and its 1σ bands (D VWAP, D VWAP U1, D VWAP L1, W VWAP L1, M VWAP L1); the 2σ bands are drawn without a label. The bands show how far price has stretched from the average. During the October 7 flush GC traded below the daily 2σ band, about $12 under it at the 08:30 low. Many participants measure their executions against VWAP, which is why traders watch how price behaves around it and its bands.
Session levels
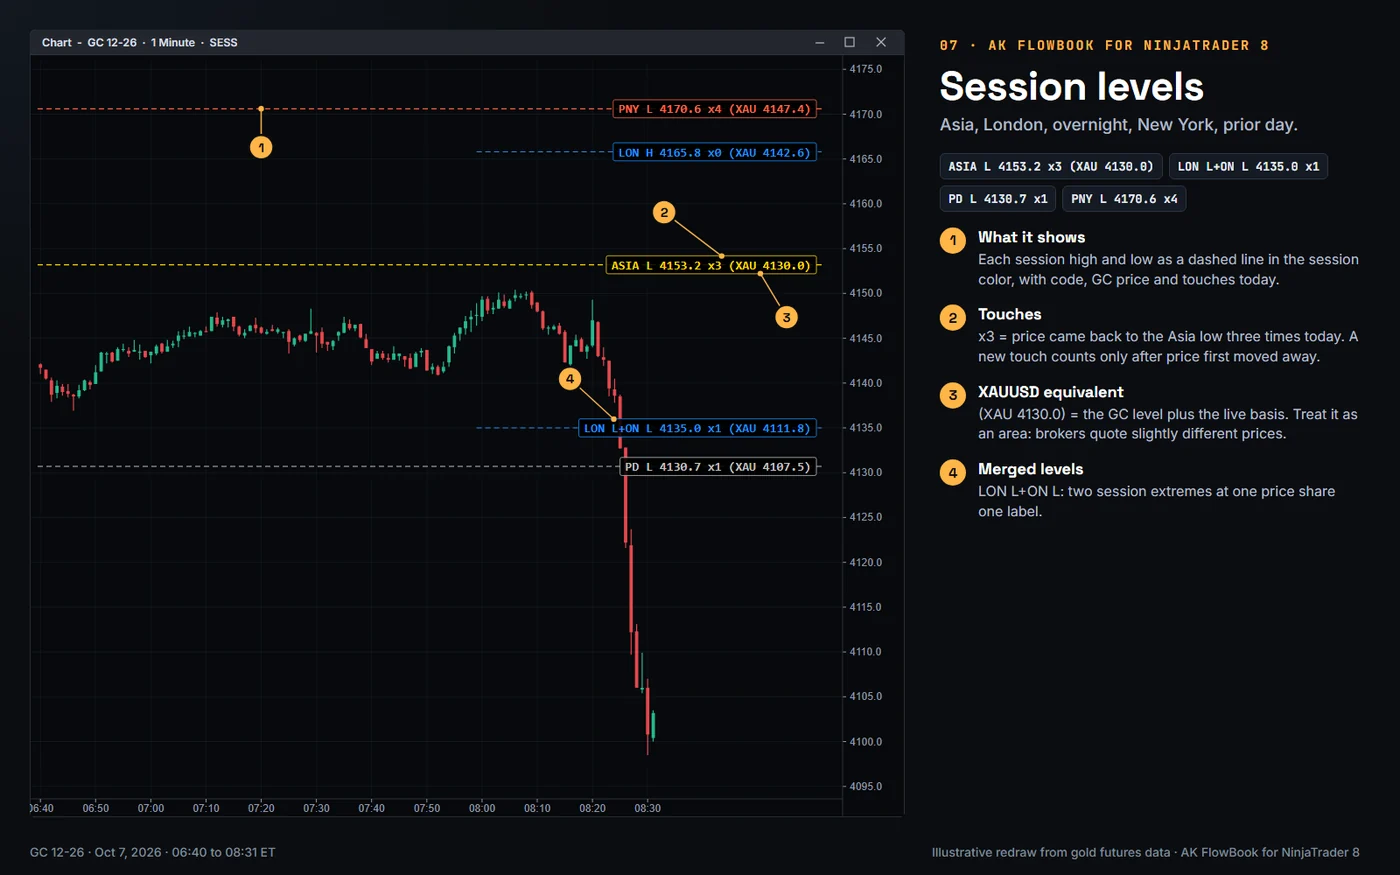
Gold trades almost around the clock and each session leaves a high and a low. The SESS layer draws them as dashed lines in the session color: ASIA gold, LON blue, ON purple, NY1H green, NY orange-red, PD silver and PNY tomato. Each label reads code, GC price, touches today and the XAUUSD equivalent, for example ASIA L 4153.2 x3 (XAU 4130.0): price came back to the Asia low three times today, and the same level in spot gold is about 4130.0 with the live basis. Levels that share a price merge, as LON L+ON L 4135.0 x1. A touch counts only after price first moved away from the level. The XAU part is shown only when a fresh basis is available.
Candle volume filters
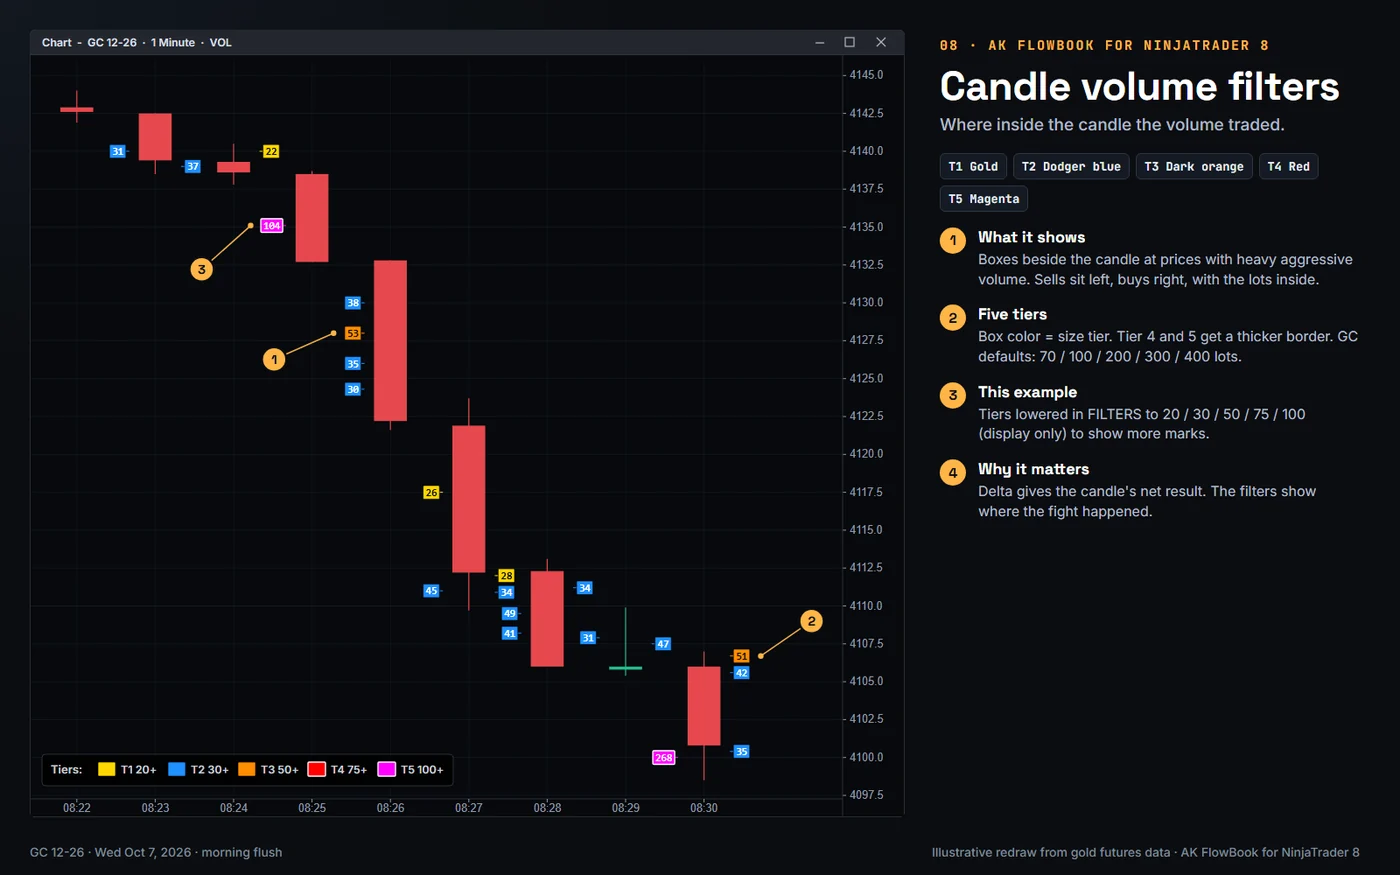
A candle shows where price traveled, not where the volume traded. The candle volume filters open it up: a small box beside the candle at each price where aggressive volume was heavy, sells on the left and buys on the right, with the lots printed inside. The box color is the size tier: gold, Dodger blue, dark orange, red and magenta, with a thicker border on tiers 4 and 5. GC defaults are 70, 100, 200, 300 and 400 lots. In the 08:30 candle on October 7, 268 lots were sold at 4100.0 alone. Delta gives the candle's net result; the filters show where inside the candle the fight happened. The card example uses lower tiers set in FILTERS (display only).
Order-flow event labels
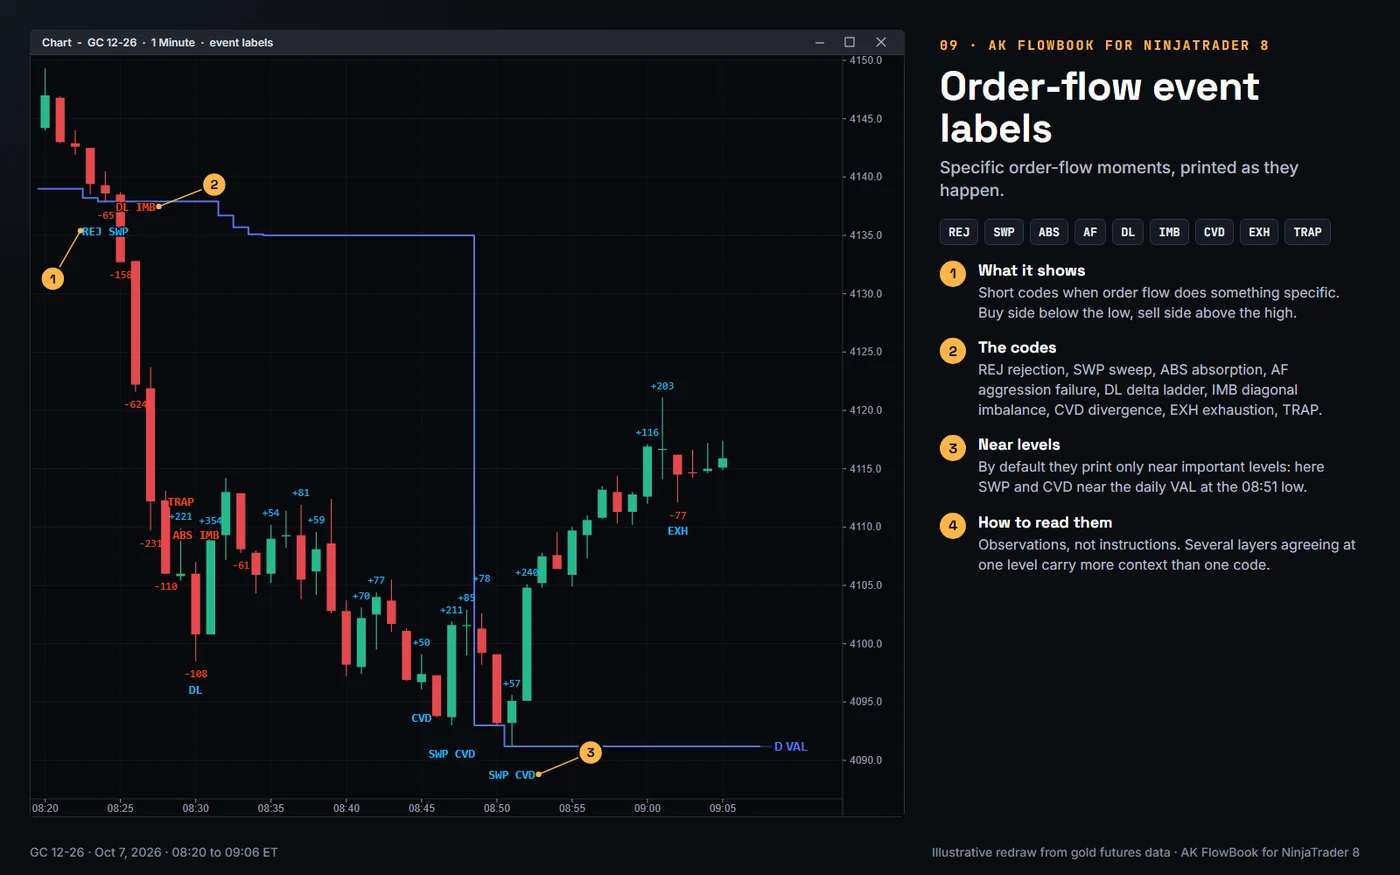
Event labels are short codes that print when order flow does something specific: REJ rejection, SWP sweep, ABS absorption, AF aggression failure, DL delta ladder, IMB diagonal imbalance, CVD divergence between cumulative delta and price, EXH exhaustion and TRAP. Buy-side events print below the candle low, sell-side events above the high. By default they print only near important levels, where they carry context. On October 7 AK FlowBook printed REJ SWP as price came down toward the London low, DL IMB and TRAP during the flush, and SWP CVD at the 08:47 and 08:51 lows, next to the daily VAL. Read them as observations of what happened and where, never as instructions.
Market context panel
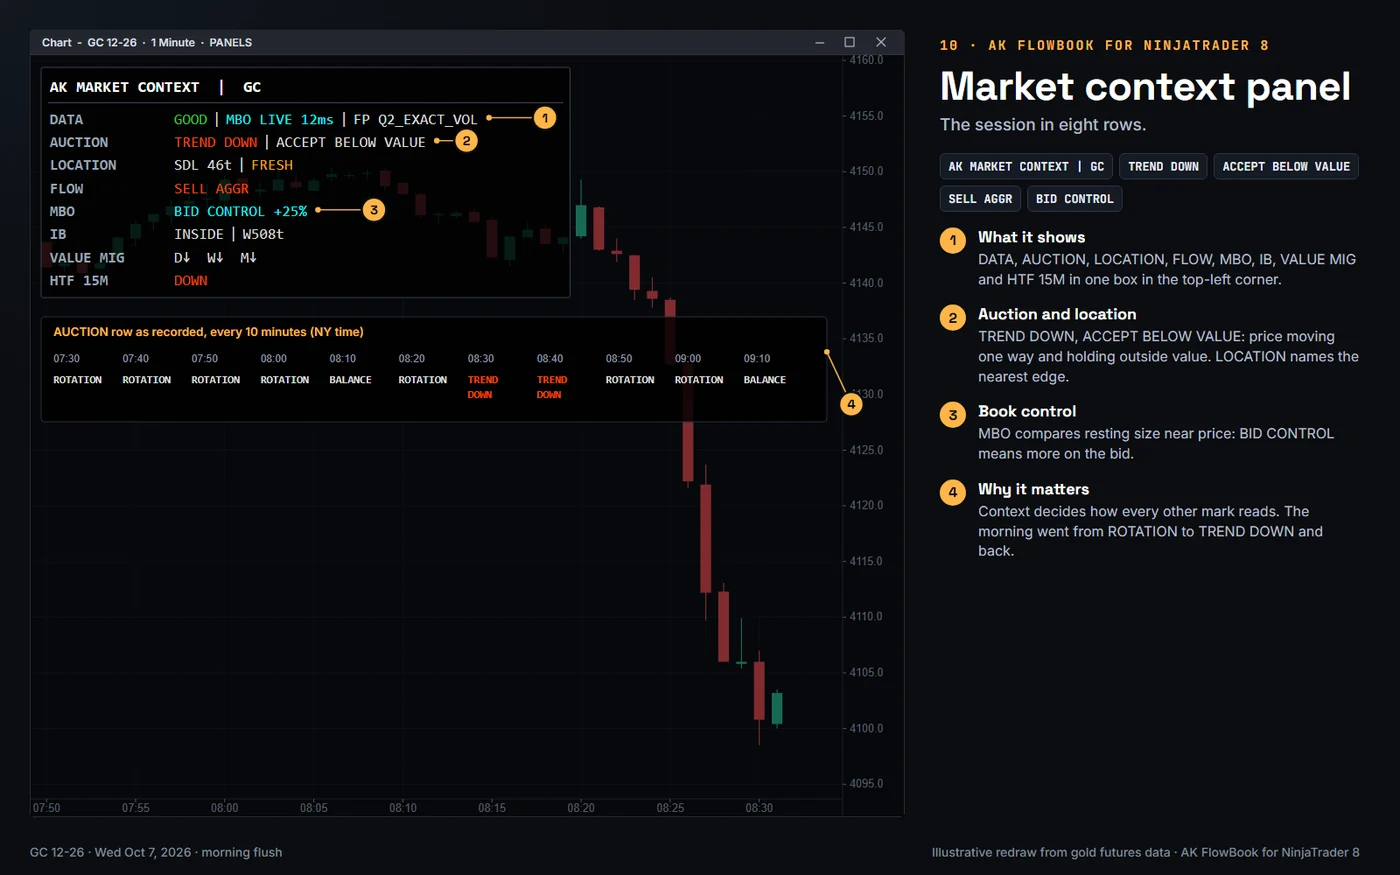
The market context panel sums up the session in eight rows in the top-left corner. DATA says whether the data is healthy. AUCTION names the auction state and where price is against value, for example TREND DOWN | ACCEPT BELOW VALUE. LOCATION names the nearest important edge and how fresh it is. FLOW compares effort and result (SELL AGGR, BALANCED AGGRESSION). MBO shows which side of the resting book is stronger (BID CONTROL +25%). IB places price against the initial balance, VALUE MIG shows which way value is moving for day, week and month, and HTF 15M gives the 15-minute picture. On October 7 the AUCTION row went from ROTATION to TREND DOWN at 08:30 and back to ROTATION by 08:50.
Info line and data health
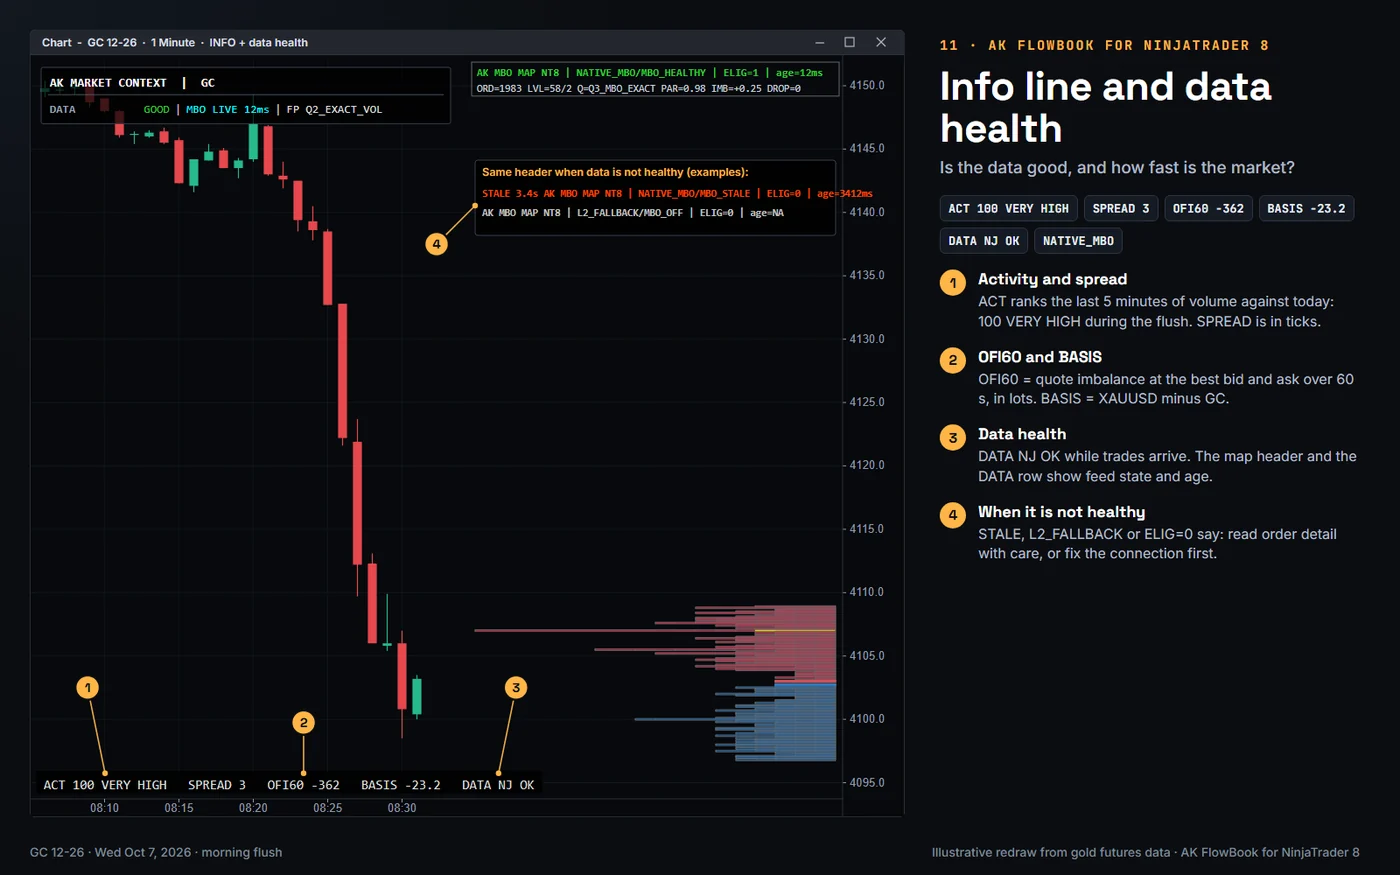
The info line runs along the bottom-left of the chart. ACT ranks the last five minutes of volume against today's five-minute volumes from 0 to 100 (ACT 100 VERY HIGH during the flush). SPREAD is the bid-ask spread in ticks. OFI60 is the order-flow imbalance at the best bid and ask over 60 seconds, in lots. BASIS is XAUUSD minus GC, the value added to a GC level to get its XAU equivalent. DATA NJ OK confirms trades are arriving. A NEWS item with the time to the next and since the last scheduled release appears only when one is in the calendar; on this chart there is none. Together with the map header (NATIVE_MBO/MBO_HEALTHY, STALE, L2_FALLBACK) and the DATA row of the panel, it tells you whether the order detail on the chart can be trusted right now.
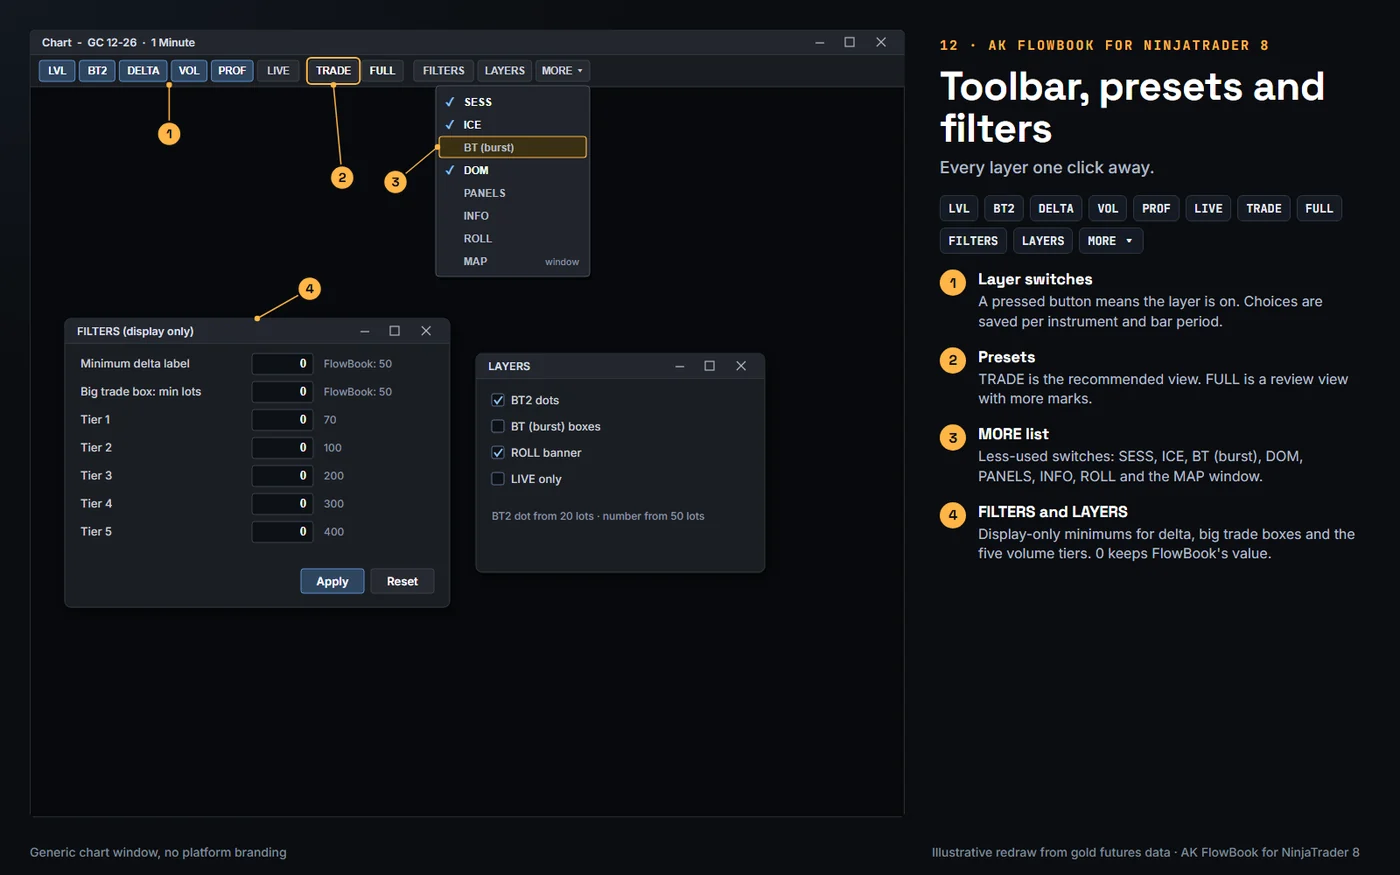
Toolbar, presets and filters
AK FlowBook adds its buttons to the chart toolbar: LVL, BT2, DELTA, VOL, PROF, LIVE, the bold presets TRADE and FULL, then FILTERS, LAYERS and MORE ▾. A pressed button means the layer is on, and choices are saved per instrument and bar period. TRADE is the recommended view; FULL is a review view with more marks. MORE ▾ holds the less-used switches: SESS, ICE, BT (burst), DOM, PANELS, INFO, ROLL and the MAP window. FILTERS sets display-only minimums for delta labels, big trade boxes and the five volume tiers (0 keeps FlowBook's value), and LAYERS sets the BT2 minimums. The toolbar changes what is drawn, never how AK FlowBook reads the market.
What is real and what is illustrative
- Real (October 7, 2026 data): the GC 1-minute candles, delta numbers, big trade bursts and print counts, BT2 single orders, candle volume filter values, the order book rebuilt order by order from the exchange feed (orders, sizes, queue positions, the reloading order), the icebergs (122 lots traded against 5 shown at 4100.0; break time from AK FlowBook's own iceberg record), the profile, VWAP, naked and session levels with touches, the event codes and the context panel wording as AK FlowBook recorded them, ACT, spread, OFI60 and the basis.
- Illustrative: the map badge scores, the map header
ELIG/agevalues and theLVL,Q,PAR,DROPstats, the age andFPtag in theDATArow, the Smart role assignment (DRIVE, EDGE, LARGE) and the scores left out of the panel rows. The map detail in the hero is a zoomed inset of the same book. All images are redraws in the product's style, not screenshots.
Built for traders with a full volume-trading setup: NinjaTrader 8 with a futures feed, Rithmic for order-by-order data. On a laptop with a broker chart? See AK FlowBook for TradingView.
Education only. Not financial advice. Trading futures and CFDs carries a high risk of loss. NinjaTrader is a trademark of NinjaTrader Group, LLC; we are not affiliated.