Documentation menu
Levels: volume profile, naked levels and VWAPs
Volume profile levelsHVN and LVNVWAPs and bandsValue migrationThe label columnColorsHow to read itSettings
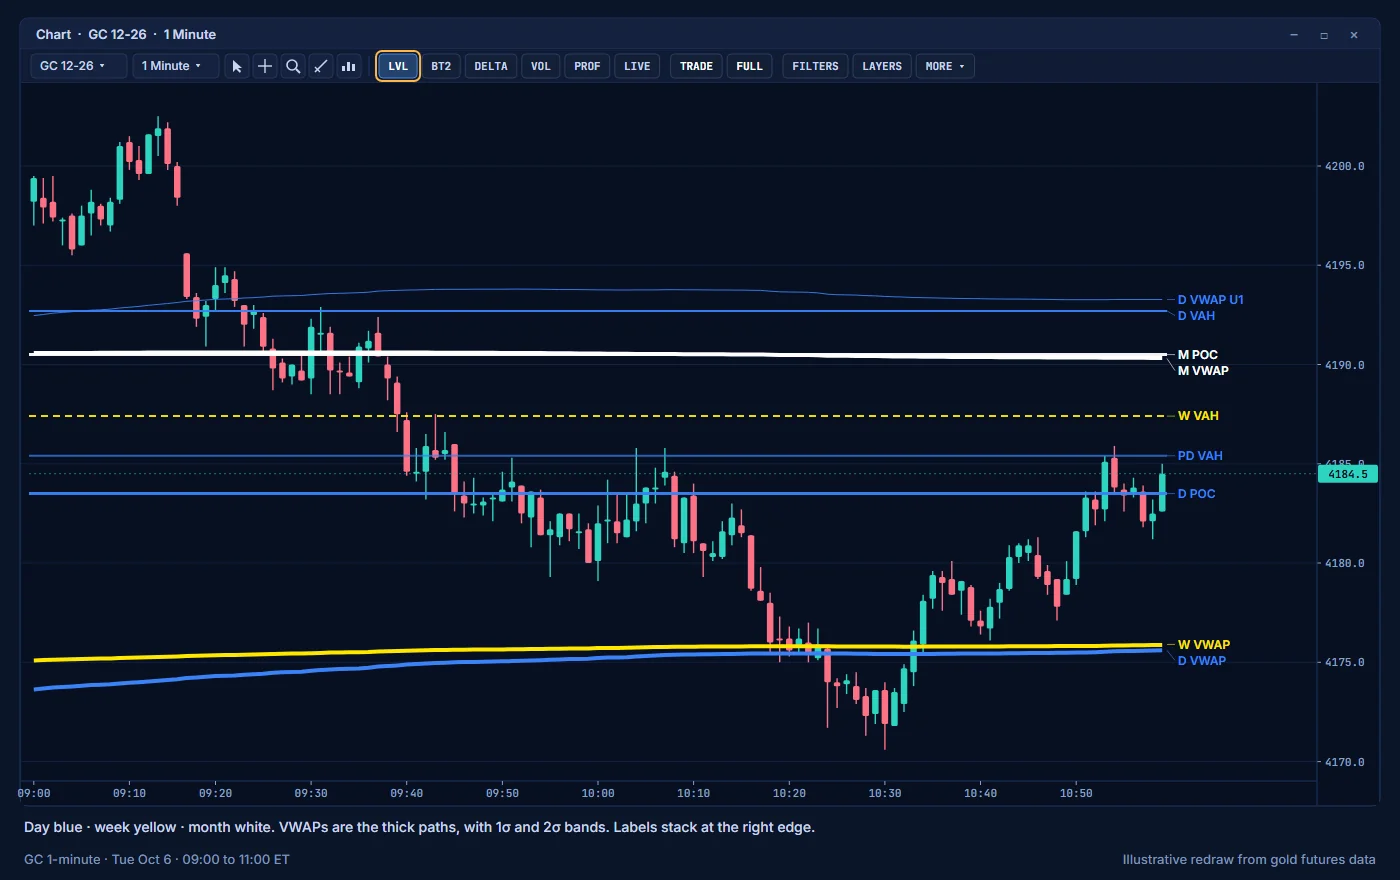
The LVL layer draws the prices where the market did most of its business: volume profile levels and VWAPs for the day, the week and the month. These are computed from traded volume, not drawn by hand.
Turn the layer on or off with LVL on the toolbar.
Volume profile levels
A volume profile counts how much traded at each price over a period.
| Level | Meaning |
|---|---|
| POC | Point of control: the price with the most volume in the period. |
| VAH | Value area high: the top of the range where most of the period's volume traded. |
| VAL | Value area low: the bottom of that range. |
AK FlowBook draws these for three timeframes:
- Developing levels for the current day, week and month. They move as the period trades. The POC line is 3 px, VAH and VAL are 2 px.
- Finished levels from past periods, drawn as segments over the period they belong to.
- Previous day (
PD) and two days ago (P2D) POC, VAH and VAL. - Naked levels: a past POC, VAH or VAL that price has not touched since. A naked level is extended to the right as a dashed line until price touches it.
HVN and LVN
Inside each profile, AK FlowBook finds the strongest volume nodes.
- HVN (high volume node): a price area where a lot traded. The market accepted these prices.
- LVN (low volume node): a price area where little traded. Price moved through quickly.
It draws the 2 strongest of each per profile, as dashed lines, labeled by rank: D HVN1, W LVN2. See the guide Watching price at HVN and LVN.
VWAPs and bands
VWAP is the volume-weighted average price of a period.
- Daily, weekly and monthly VWAP, drawn as a 4 px center line.
- Bands at ±1σ and ±2σ (standard deviations), drawn as 1 px lines.
- Previous-period VWAP paths.
- Naked previous VWAPs: a previous VWAP that price has not touched since, labeled for example
PRE D VWAP.
The label column names the VWAP and its 1σ bands: M VWAP, M VWAP U1 (upper), M VWAP L1 (lower). The ±2σ bands are drawn but have no label.
Value migration
Value migration compares where value is now with where it was. The VALUE MIG row of the market context panel shows it for each timeframe, for example D↑ W↓ M→: daily value moving up, weekly value moving down, monthly value flat.
The label column
Labels sit in a column at the right edge of the chart, stacked so they do not overlap.
| Label part | Meaning |
|---|---|
D, W, M | Day, week, month |
POC, VAH, VAL | The profile level |
VWAP, U1, L1 | VWAP, upper 1σ band, lower 1σ band |
HVN1, LVN2 | Strongest high or low volume node, with its rank |
PD | Previous day, for example PD POC |
P2D | Two days ago, for example P2D VAH |
ND3 | A naked daily level from further back, for example ND3 VAL |
N D, N W, N M | Naked daily, weekly or monthly level, for example N W POC |
PRE D VWAP | A previous daily VWAP that is still naked |
When two levels of the same timeframe share a price, they merge into one label, such as D POC/VAH. When naked levels share a price, they join with + , such as N D POC + N W POC. The column shows up to 16 naked level labels and 6 naked VWAP labels.
Colors
| Timeframe | Color |
|---|---|
| Day | Blue |
| Week | Yellow |
| Month | White |
Naked level lines are 2 px and dashed. Weekly VAH and VAL use a dashed style.
How to read it
- Value edges (VAH and VAL) are where the market decides between acceptance and rejection. Watch whether price holds outside value or returns inside.
- A naked level is a price the market has not revisited. Many traders watch these as levels to watch.
- A merged label shows that several levels sit at one price. Note which timeframes meet there.
- Combine levels with order flow: what delta, big trades and the map show when price reaches a level is the context.
Settings
| Setting | Group | Default |
|---|---|---|
| Levels (POC/VAH/VAL/VWAP/HVN...) | 00 Chart View | On |
| Show Daily / Weekly / Monthly Profile Levels | 05 Levels & Context | On |
| Show Daily / Weekly / Monthly VWAPs | 05 Levels & Context | On |
| Show Clear Level Labels | 05 Levels & Context | On |
| Show Previous Day VAH / VAL / POC (PD) | 05 Levels & Context | On |
| Show 2nd Previous Day VAH / VAL / POC (P2D) | 05 Levels & Context | On |
| Show Naked Profile Levels | 05A Advanced Levels | On |
| Show HVN / LVN | 05A Advanced Levels | On |
| HVN/LVN Nodes Per Profile | 05A Advanced Levels | 2 |
| Show VWAP 1-Sigma Bands, Show VWAP 2-Sigma Bands | 05A Advanced Levels | On |
| Show Value Migration Labels | 05A Advanced Levels | On |
| Level Label Font Size | 05C Level Appearance | 12 |
| Level Label Width Pixels | 05C Level Appearance | 130 |
| Profile VAH / VAL Line Width, POC Line Width, Naked Level Line Width | 05C Level Appearance | 2, 3, 2 |
| Monthly, Weekly, Daily Profile / Level Color | 05C Level Appearance | White, Yellow, Blue |
Education only. Not financial advice. Trading futures and CFDs carries a high risk of loss.