Documentation menu
Market context panel: what each row means
The market context panel is a compact box in the top-left corner of the chart. In eight short rows it tells you whether your data is healthy, what kind of auction the market is in, where price sits against the levels, and what order flow has been doing. Context decides how you read every other mark on the chart.
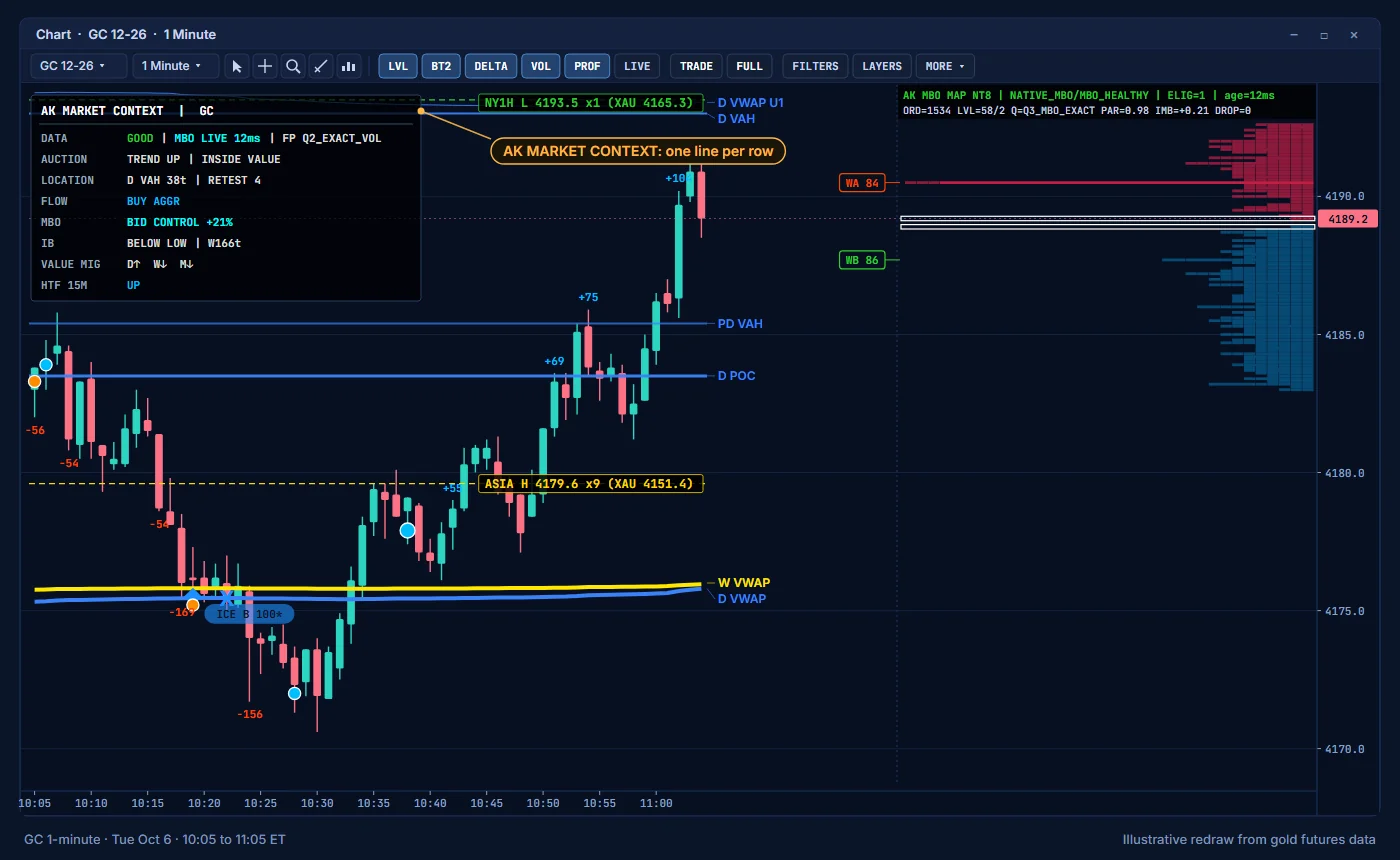
The panel is hidden by default, in both the TRADE and the FULL view. Open MORE on the toolbar and click PANELS to show it.
The header
The header reads AK MARKET CONTEXT followed by the instrument, for example AK MARKET CONTEXT | GC.
The rows
| Row | What it tells you | Example values |
|---|---|---|
DATA | The health of the data AK FlowBook is reading. | GOOD, MBO LIVE, HISTORICAL, STALE BOOK, DEGRADED, MBO UNAVAILABLE |
AUCTION | The auction state, and where price is against value. | BALANCE, TREND UP, INSIDE VALUE, ACCEPT ABOVE VALUE |
LOCATION | The nearest important level and how far away it is. | FIRST TOUCH, RETEST, FRESH, NO IMPORTANT EDGE NEARBY |
FLOW | Effort versus result: who is aggressive and whether it works. | BUY AGGR, BALANCED AGGRESSION, SELL AGGR FAILED, ABS |
MBO | Which side controls the resting order book. | BID CONTROL, ASK CONTROL, BALANCED |
IB | Where price is against the initial balance. | INSIDE, ABOVE HIGH, BELOW LOW |
VALUE MIG | Which way value is moving for day, week and month. | D↑ W↓ M→ |
HTF 15M | The picture on the 15-minute timeframe. |
DATA
| Value | Meaning |
|---|---|
GOOD | Order-by-order data is current. You also see MBO LIVE and the data age in milliseconds, for example MBO LIVE 12ms. |
HISTORICAL | The chart is still processing history. Live readings start after the separator. |
WAITING FOR DEPTH | Live, but no order book data has arrived yet. |
STALE BOOK or STALE MBO | The order book or the order-by-order feed has not updated for the time shown, in seconds. |
DEGRADED | Part of the data is missing or late. Read the other rows with care. |
MBO UNAVAILABLE | No order-by-order data. AK FlowBook works with Level 2 totals. |
The row ends with a short footprint data quality tag that starts with FP.
If DATA is not GOOD and you have a Rithmic connection, fix the data first. See Troubleshooting.
AUCTION
The first part names the auction state:
| Value | Meaning |
|---|---|
BALANCE | Price is rotating inside a range. Both sides accept these prices. |
ROTATION | Price is moving back and forth without direction. |
TREND UP / TREND DOWN | Price is moving in one direction and holding its gains. |
EXPANSION UP / EXPANSION DOWN | Price is leaving a range with range expansion. |
RESPONSIVE BUYING / RESPONSIVE SELLING | One side is responding to prices it sees as cheap or expensive. |
TESTING HIGHER / TESTING LOWER | Price is probing beyond recent prices. |
WARMUP | Not enough data yet in this session for a reading. |
The second part shows where price is against value: INSIDE VALUE, or ACCEPT, REJECT or TEST combined with ABOVE VALUE or BELOW VALUE. Acceptance means price is holding outside value. Rejection means it went outside and came back.
LOCATION
LOCATION names the nearest important level, its distance in ticks (for example 12t), and how fresh it is:
FIRST TOUCH: price is at this level for the first time today.RETESTwith a number: price has come back to it before.FRESH: the level has not been tested.NO IMPORTANT EDGE NEARBY: price is between levels.
The row can end with a short rating of the level.
FLOW
FLOW compares effort and result. BUY AGGR or SELL AGGR names the aggressive side, with EFF for how efficiently price moved for that effort. BALANCED AGGRESSION means neither side dominates. BUY AGGR FAILED or SELL AGGR FAILED means the aggressive side pushed but price did not follow. A part starting with ABS reports absorption.
MBO
MBO shows which side of the resting order book is stronger: BID CONTROL, ASK CONTROL or BALANCED, with a percentage. It can add a recent book event, such as orders pulled from or stacked into the book. This row needs depth data.
IB
IB shows price against the initial balance (the range of the opening period): INSIDE, ABOVE HIGH or BELOW LOW, followed by the initial balance state and its width in ticks (for example W42t).
VALUE MIG
Value migration shows the direction value is moving for each timeframe: ↑ up, ↓ down, → flat. For example D↑ W↓ M→. See Levels.
Colors
| Color | Meaning |
|---|---|
| Green | Good |
| Orange | Warning |
| Blue | Buy side |
| Orange-red | Sell side |
| Aqua | MBO data |
| Light grey | Normal |
Settings
| Setting | Group | Default |
|---|---|---|
| Show Market Context Panel | 06 Market Context Panel | On (the panel shows when PANELS is on, which is off by default) |
| Old panels (context / iceberg box) | 00 Chart View | Off (the same switch as PANELS) |
| Panel Position | 06 Market Context Panel | 0 Top Left |
| Panel Width Pixels | 06 Market Context Panel | 390 |
| Show Data Health, Show Auction / Acceptance, Show Nearest Location, Show Effort vs Result, Show MBO Control, Show Initial Balance, Show D/W/M Value Migration, Show Completed HTF 15M Context | 06 Market Context Panel | On |
Education only. Not financial advice. Trading futures and CFDs carries a high risk of loss.