Documentation menu
Icebergs: hidden size that keeps refilling
An iceberg is a resting order that shows only a small part of its size in the order book. Each time the visible part trades, the order refills. The book keeps showing a few lots, while the trades at that price add up to much more.
AK FlowBook reads the order book order by order. When it sees a resting order that keeps refilling as it trades, it marks the price on the chart.
L2_FALLBACK, AK FlowBook cannot see individual orders and does not draw icebergs. See Requirements.What you see
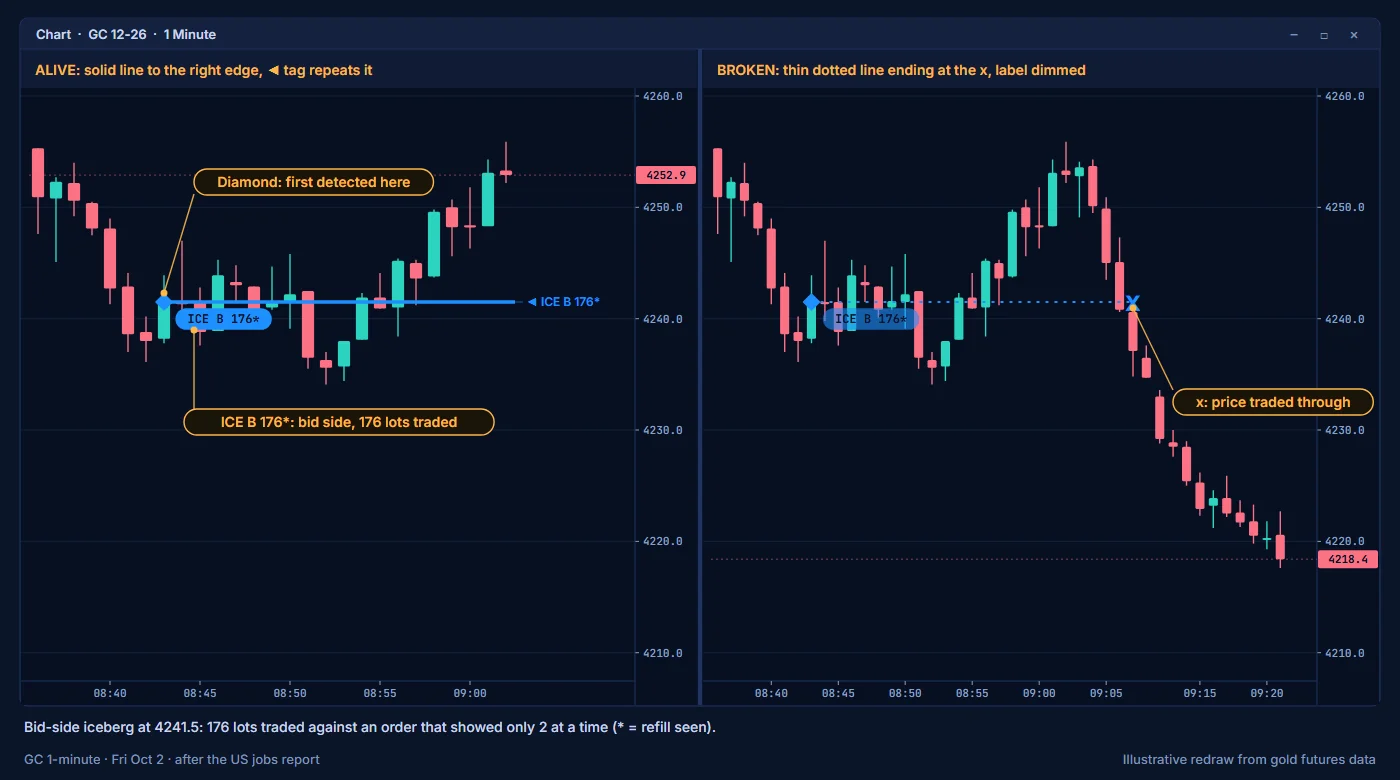
- A horizontal line at the iceberg price. Blue for a bid-side iceberg (a hidden buyer). Crimson for an ask-side iceberg (a hidden seller).
- A solid line while the iceberg is alive. Larger icebergs get a thicker line.
- A thin dotted line after it broke, with an
xwhere it broke. - A
■where a larger iceberg was first detected. - A label in a colored box next to the candle where the iceberg started, such as
ICE B 21*orICE S 36. It sits just below a bid-side line and just above an ask-side line. The box turns dimmer once the iceberg is broken. - At the right edge of the chart,
◄tags repeat the alive icebergs nearest to price, so you can see them even when the line started far to the left. - A small diamond on the candle where an iceberg was flagged: blue on the bid side, orange-red on the ask side.
In the MBO Price Map, iceberg orders are outlined in gold and can carry an ICE badge. See MBO Price Map.
Reading the label
| Part | Meaning |
|---|---|
ICE | An iceberg: at least half of the size that traded against the resting order was hidden. |
* | The hidden order was also seen refilling after it traded. This is the clearest iceberg. |
BIG | A large resting order that was mostly visible: less than half of the traded size was hidden. |
HID | Hidden volume traded at this price, but no visible resting order there accounts for it. |
B | Bid side: the resting order was buying. |
S | Ask side: the resting order was selling. |
| Number | For ICE and BIG, the lots that traded against the resting order. For HID, the hidden lots. |
Examples: ICE B 21*, ICE S 36, HID B 40, BIG S 55.
When icebergs sit at prices a few ticks apart on the same side, they share one label and the number is their total.
Alive and broken
There is no "hold" or "break" text on the chart. The line style tells you the state.
| State | How it looks | What it means |
|---|---|---|
| Alive | Solid line | The iceberg is still there and still refilling. |
| Broken | Dotted line, x at the break | Price traded through the price, or the order was removed. |
How to read it
- An iceberg shows intent. Someone wants to trade size at that price without showing it.
- A bid-side iceberg below price is a level to watch: aggressive sellers are trading into a buyer who keeps refilling.
- Whether the level matters is decided by what trades next. Watch delta, the candle volume filters and the map as price comes back to it.
- After a break, note how price behaves when it returns to the same price. The broken line stays on the chart as a reference.
- Icebergs at a level you already watch, such as a value edge or a session high, carry more context than icebergs in the middle of a range.
The guide Reading absorption shows icebergs together with delta and Smart roles.
Settings
| Setting | Group | Default |
|---|---|---|
| Iceberg marks | 00 Chart View | On |
Show Iceberg Events (ICE event label) | 01A Event Controls | Off |
| Accent Iceberg / Reload Segments (map) | 04B2 Map Order Segments | On |
| Badge: Iceberg (ICE) (map) | 04B4 Map Event Badges | On |
| Show icebergs on chart (diamonds) | Icebergs | On |
Turn the layer on or off with ICE in the MORE list on the toolbar. Advanced users can tune the iceberg detection thresholds in the 07 Manual Thresholds group. We recommend the defaults.
Education only. Not financial advice. Trading futures and CFDs carries a high risk of loss.