Documentation menu
Guide: watching price at HVN and LVN levels
What HVN and LVN meanHow AK FlowBook draws themWhat to look for at an HVNWhat to look for at an LVNCombining nodes with other levelsAn illustrative example
After this guide you will know what high and low volume nodes are, how AK FlowBook draws them, and what order-flow context to look for when price reaches one.
What HVN and LVN mean
A volume profile counts how much traded at each price. Its shape has peaks and valleys.
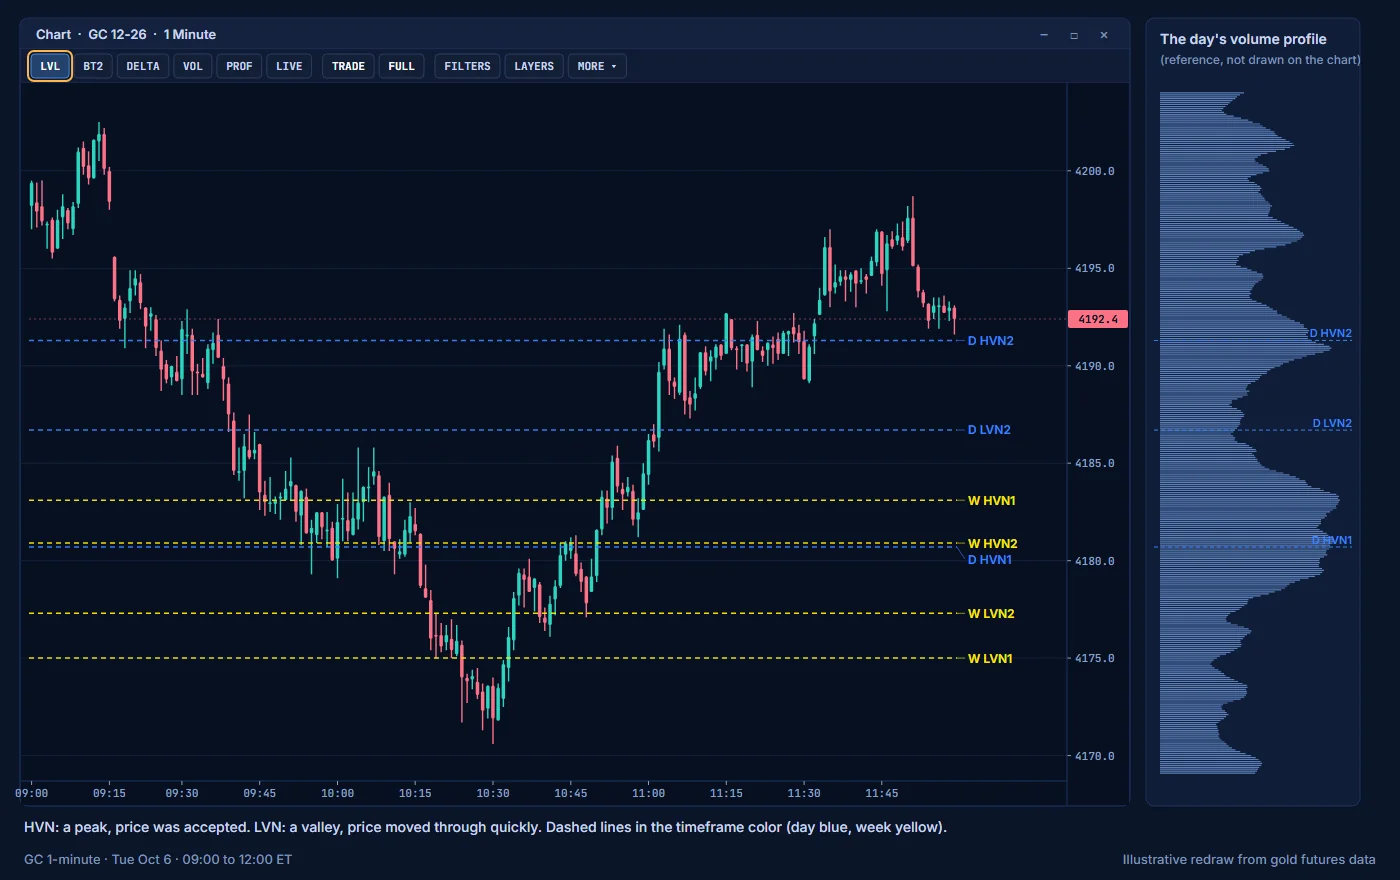
- HVN (high volume node): a peak. The market traded a lot there. In auction terms, these prices were accepted: buyers and sellers both agreed to do business.
- LVN (low volume node): a valley. Little traded there. Price passed through quickly, because one side did not want to trade at those prices.
In auction theory, price tends to slow down and rotate around accepted prices (HVN) and to move quickly through rejected prices (LVN). This is a way to frame what you see, not a rule.
How AK FlowBook draws them
- For each profile (day, week, month), AK FlowBook finds the 2 strongest HVN and the 2 strongest LVN.
- They are drawn as dashed lines in the timeframe color: blue for day, yellow for week, white for month.
- Labels show the timeframe and rank:
D HVN1,D HVN2,W LVN1,M LVN2. - The MBO Price Map tags rows that sit at an HVN or LVN, so you can see the book at that price.
See Levels for all level types.
What to look for at an HVN
An HVN is a price area where both sides were active. When price comes back to it:
- Is price slowing down? Look at the candles. Are ranges getting smaller?
- What is delta doing? Mixed delta (positive and negative candles in turn) fits two-sided trade. A run of large delta in one direction that does not move price fits absorption. See Reading absorption.
- What does the book show? In the map, look for resting size on both sides, walls (
WB,WA) or icebergs at the node. - What does the context panel say?
BALANCEorROTATIONin the AUCTION row fits rotation around the node.
What to look for at an LVN
An LVN is a price area the market moved through quickly. When price reaches one:
- Is price moving fast? Look at candle size and the
ACTvalue on the info line. - Is the book thin? In the map, look for little resting size or a
VACbadge (liquidity vacuum). - Is aggression following through? Large delta with large price movement fits a move through the node. Big trades with a
DRIVErole fit the same picture. - Is price stopping at the LVN instead? If price reaches the LVN and turns back, the area may be acting as an edge between two value areas. Watch delta and the map there.
Combining nodes with other levels
Nodes are most useful together with the other levels.
- An LVN between two HVNs often separates two areas of value. Note which side price accepts.
- An HVN at the same price as a VWAP band or a naked POC means several reference points meet there. The label column shows them stacked or merged.
- Daily nodes change during the day. Weekly and monthly nodes are more stable.
An illustrative example
The numbers below are illustrative.
Price drops from the daily POC toward W LVN1. As it enters the node, candles get larger, the map shows little size below price and a VAC badge appears. Delta prints -140 and -160 and price moves with it. Below the LVN sits W HVN1. As price reaches it, candles shrink, delta turns mixed and the map shows resting bids on several rows. The AUCTION row changes to ROTATION.
What this describes: price moved quickly through a low-volume area, then slowed in a high-volume area. W HVN1 is the level to watch for whether price accepts it or leaves it.
Education only. Not financial advice. Trading futures and CFDs carries a high risk of loss.