Documentation menu
Guide: session highs and lows as levels to watch
Why session extremes matterRead the label firstFirst touch or retestWhat to look for at a session extremeStep by stepUsing XAU equivalentsCommon mistakes
After this guide you will know how to use AK FlowBook's session levels as context, and what order flow to look for when price reaches a session high or low.
Why session extremes matter
Gold trades through Asia, London and New York. Each session leaves a high and a low. Many traders place orders around these prices: some expect them to hold, others wait for a break. That makes session extremes places where order flow often becomes active. They are reference points, not predictions.
AK FlowBook draws them with the SESS layer. See Session levels for every code and color.
Read the label first
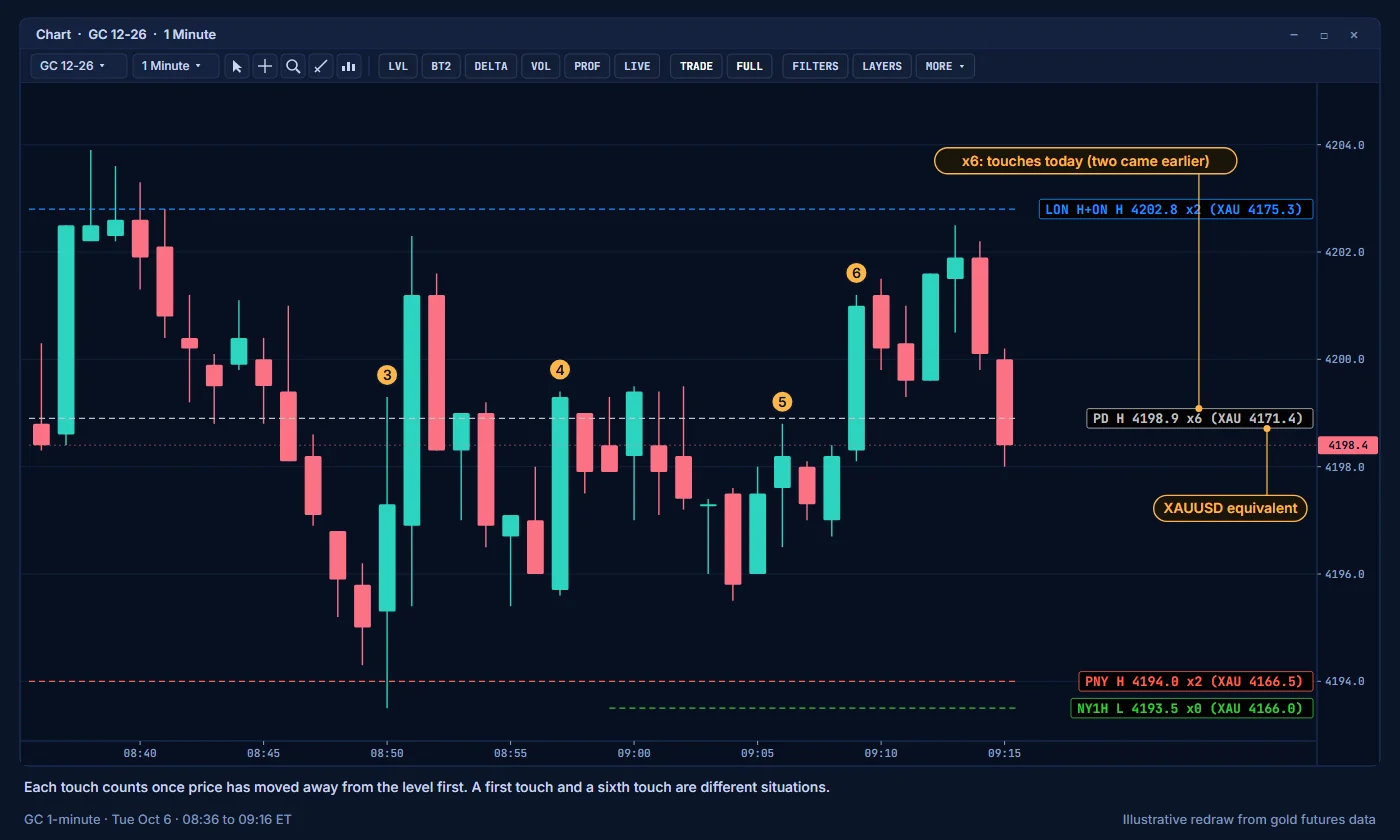
Take LON H 4251.0 x3 (XAU 4222.1):
LON H: the London session high.4251.0: the price in GC futures.x3: price has touched it 3 times today.(XAU 4222.1): the XAUUSD equivalent, when a fresh basis is available.
A merged label such as PD H+ASIA H means two session extremes sit at one price.
First touch or retest
The touch count and the LOCATION row of the context panel tell you how fresh a level is.
| Situation | How it shows | What it means |
|---|---|---|
| Untested level | No touches yet; LOCATION may read FRESH | Orders resting near it have not been tested. |
| First touch | x1; LOCATION reads FIRST TOUCH | The first test today. Watch the reaction closely. |
| Retest | x2 or more; LOCATION reads RETEST with a number | The level has been tested before. Each test can use up resting orders. |
What to look for at a session extreme
When price reaches a session high or low, three outcomes are common. AK FlowBook helps you tell them apart as they happen.
| Outcome | What order flow shows |
|---|---|
| Rejection | Price probes the level and is pushed back. Look for a REJ label, delta failing to move price, and absorption on the other side: an iceberg, a FAIL big trade, or an ABS badge in the map. |
| Sweep | Price runs just beyond the level, takes the resting orders there, then returns. Look for SWP, a burst of big trades or BT2 dots at the extreme, a STP badge in the map, and then a TRAP label if price comes back against the move. |
| Acceptance | Price moves beyond the level and holds. Look for delta in the direction of the move, DRIVE roles, a thin book ahead, and the AUCTION row changing, for example to ACCEPT ABOVE VALUE or EXPANSION UP. |
These are descriptions of what the market did. None of them tells you what it will do next.
Step by step
- Before price arrives, note the session levels near price and their touch counts. Check whether other levels sit at the same price, such as a value edge or a naked POC.
- As price arrives, watch delta, the candle volume filters and the map at the level.
- At the level, look for the patterns in the table above.
- After the reaction, note what happened to the touch count and whether the level held or broke. A broken session high can become a level to watch from the other side.
Using XAU equivalents
If you follow XAUUSD on a CFD platform, the XAU part of each session label gives you the same level in spot gold prices. Treat it as an area: CFD brokers quote slightly different prices, and the basis changes over time. See Using futures levels as a CFD trader.
Common mistakes
- Treating every touch the same. A first touch and a fifth touch are different situations.
- Ignoring the session. A level made in a quiet Asian session and one made in the New York open were made by different volume.
- Watching only price. The value of session levels comes from reading order flow at them.
Education only. Not financial advice. Trading futures and CFDs carries a high risk of loss.