Documentation menu
Quick start: your first 5 minutes
Minute 1: open the chartMinute 2: choose a viewMinute 3: find your levelsMinute 4: read the candlesMinute 5: check your dataToolbar at a glanceWhat to read next
After this page you will know how to switch views, find the main layers and check that your data is complete. You need AK FlowBook installed on a GC 1-minute chart. If you have not done that yet, start with Install.
Minute 1: open the chart
- Connect to your data feed (Rithmic for order-by-order data).
- Open a GC 1-minute chart with AK FlowBook on it.
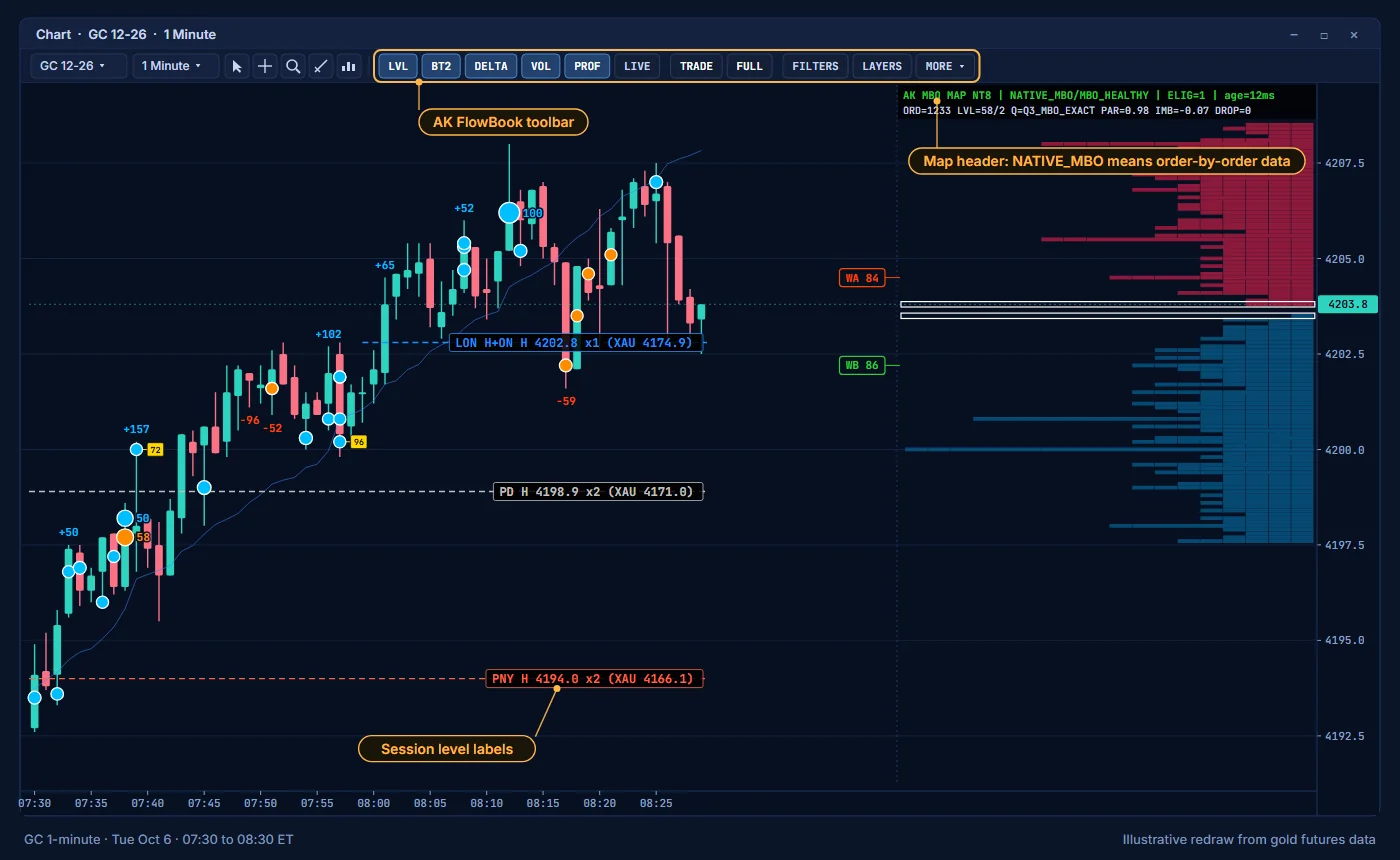
- Wait until the first load finishes. You see the toolbar along the top of the chart.
Minute 2: choose a view
Two bold buttons in the AK FlowBook part of the chart toolbar set many layers at once.
| Preset | What it gives you | When to use it |
|---|---|---|
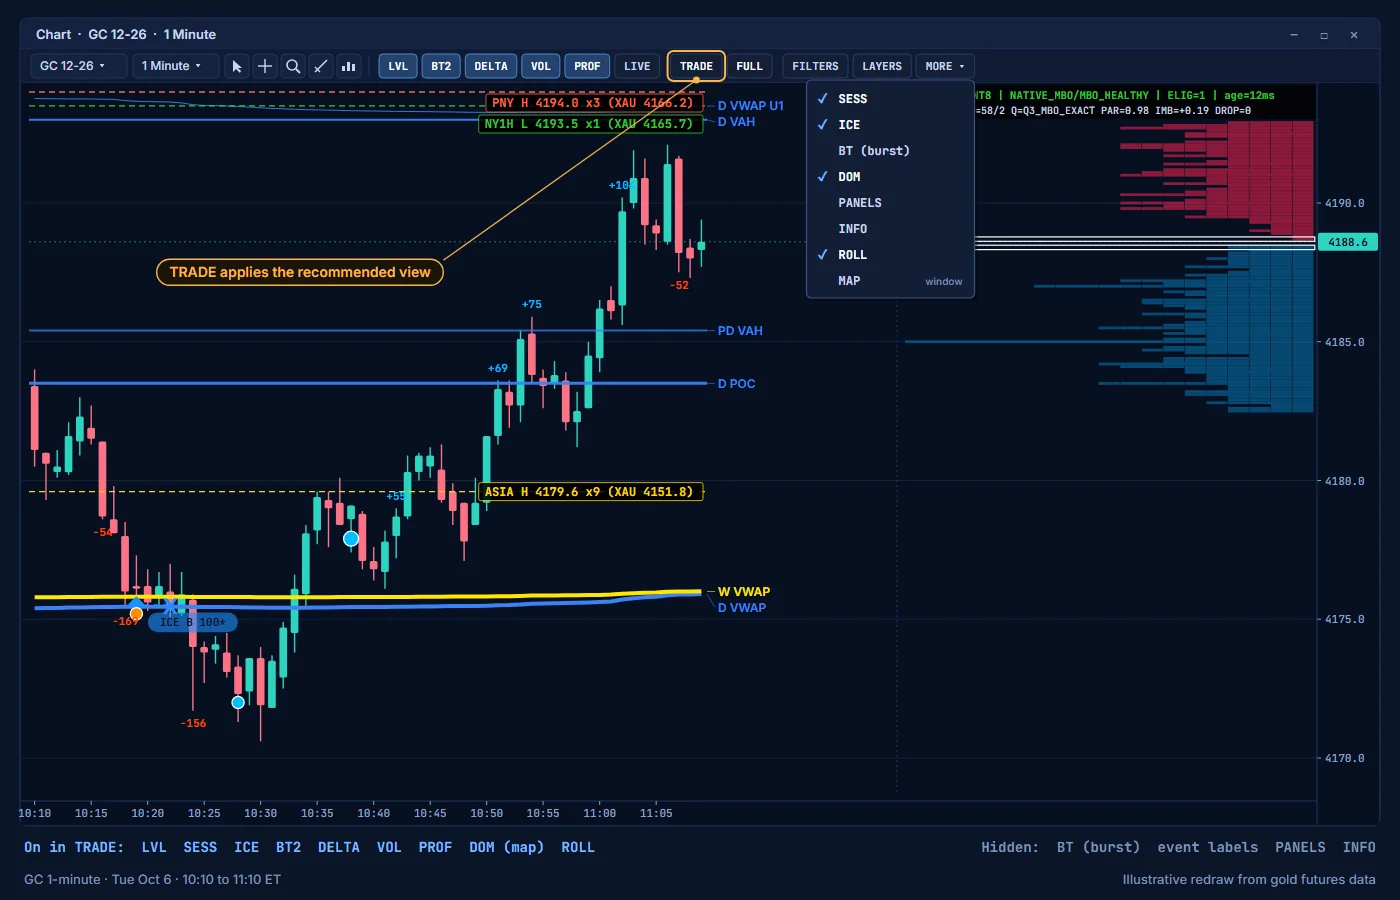
| TRADE | The view we recommend: levels, session levels, icebergs, BT2 dots, delta, candle volume filters and the MBO Price Map. Big trade boxes, event labels, the context panel and the info line start hidden. | Every day. It is also the starting view. |
| FULL | Adds big trade boxes and event labels, plus extra marks that are not part of these docs. | We recommend TRADE. Turn on single layers with their buttons instead. |
After you pick a preset, you can still switch single layers on or off. Some switches sit in the MORE ▾ list at the end of the row.
Minute 3: find your levels
Look at the right edge of the chart. The stacked labels are your levels.
- LVL draws the daily, weekly and monthly POC, VAH and VAL, the VWAPs with their bands, previous and naked levels, and HVN and LVN. Day is blue, week is yellow, month is white. See Levels.
- SESS (in MORE) draws session highs and lows, such as
LON H 4251.0 x3. The last part is how many times price touched the level today. See Session levels.
Minute 4: read the candles
- DELTA prints
+123in blue above the high or-123in orange-red below the low. It is aggressive buying minus aggressive selling for that candle. See Delta. - VOL marks the prices inside a candle where aggressive volume was significant. Sells sit on the left of the candle, buys on the right. See Candle volume filters.
- BT2 shows single aggressive orders as dots. BT (burst) (in MORE) shows big trades as boxes with their size. See Big trades.
- ICE (in MORE) shows iceberg lines and labels such as
ICE B 21*. See Icebergs.
Minute 5: check your data
Look at the header of the MBO Price Map on the right.
NATIVE_MBOmeans you have order-by-order data. You see individual orders and icebergs.L2_FALLBACKmeans AK FlowBook is using Level 2 totals. Icebergs and order segments need a Rithmic connection.REALTIME ONLYmeans the chart is still loading history.WAITING_FOR_NATIVE_DEPTHmeans live depth has not arrived yet. See Troubleshooting.
Then open MORE and click PANELS to show the market context panel. With order-by-order data, its DATA row should start with GOOD. With Level 2 data only, it reads MBO UNAVAILABLE. See Market context panel.
Toolbar at a glance
| Button | Shows |
|---|---|
| TRADE / FULL | Preset views |
| LVL | Profile levels and VWAPs |
| SESS | Session highs and lows |
| ICE | Icebergs |
| BT (burst) | Big trade boxes and Smart roles |
| BT2 | Single aggressive order dots |
| DELTA | Delta per candle |
| VOL | Candle volume filters |
| PROF | Profile histogram switch (no visible effect in v5.6) |
| DOM | Order book display |
| MAP | MBO Price Map window: fast-market mode and badges |
| PANELS | Market context panel |
| INFO | Info line |
| LIVE | Only marks seen live |
| ROLL | Contract roll banner |
| FILTERS | Display filter window |
| LAYERS | BT2 lot minimums and a few layer switches |
| MORE | SESS, ICE, BT (burst), DOM, PANELS, INFO, ROLL and MAP |
Every button is explained on The toolbar.
What to read next
- Reading absorption, a guide that combines delta, big trades, icebergs and the map.
- Settings, if you want to change defaults.
Education only. Not financial advice. Trading futures and CFDs carries a high risk of loss.