Documentation menu
Guide: reading absorption with AK FlowBook
What absorption isWhere it shows in AK FlowBookStep by stepAn illustrative exampleCommon mistakesRelated guides
After this guide you will know what absorption is, which AK FlowBook layers show it, and what to look for when it happens at a level you watch.
What absorption is
Every trade has a buyer and a seller. One side is aggressive: it crosses the spread to get filled now. The other side is passive: its order was already resting in the book.
Absorption is when heavy aggressive volume meets passive orders that take all of it, and price barely moves. The aggressive side spends effort, but there is no result. Someone on the passive side was willing to trade that much size at that price.
Absorption is a description of what happened. It does not tell you what happens next. The passive side can run out, pull its orders or be overwhelmed.
Where it shows in AK FlowBook
Absorption can show up in several layers at once. The more layers agree, the clearer the picture.
| Layer | What to look for |
|---|---|
| Delta | A large delta, for example +180, on a candle that barely moved or closed against it. |
| Candle volume filters | Strong tier boxes at the same price, on the aggressive side. |
| Big trades | A big trade box with a FAIL role: the order was absorbed and price did not follow. |
| Icebergs | An iceberg on the passive side, for example ICE S 36 above price while buyers lift the ask. |
| MBO Price Map | Resting size at a price that stays or refills while trades hit it, an ABS badge, or a gold iceberg outline. |
| Event labels | An ABS or AF (aggression failure) label at the candle. |
| Context panel | The FLOW row shows BUY AGGR FAILED, SELL AGGR FAILED or a part starting with ABS. |
Step by step
- Start with the level. Is price at a level you watch: a value edge, a POC, a VWAP band, a naked level, a session high or low? The LOCATION row of the context panel names the nearest one. Absorption in the middle of nowhere carries little context.
- Compare effort and result. Look at delta on the candles at the level. Is a large delta failing to move price?
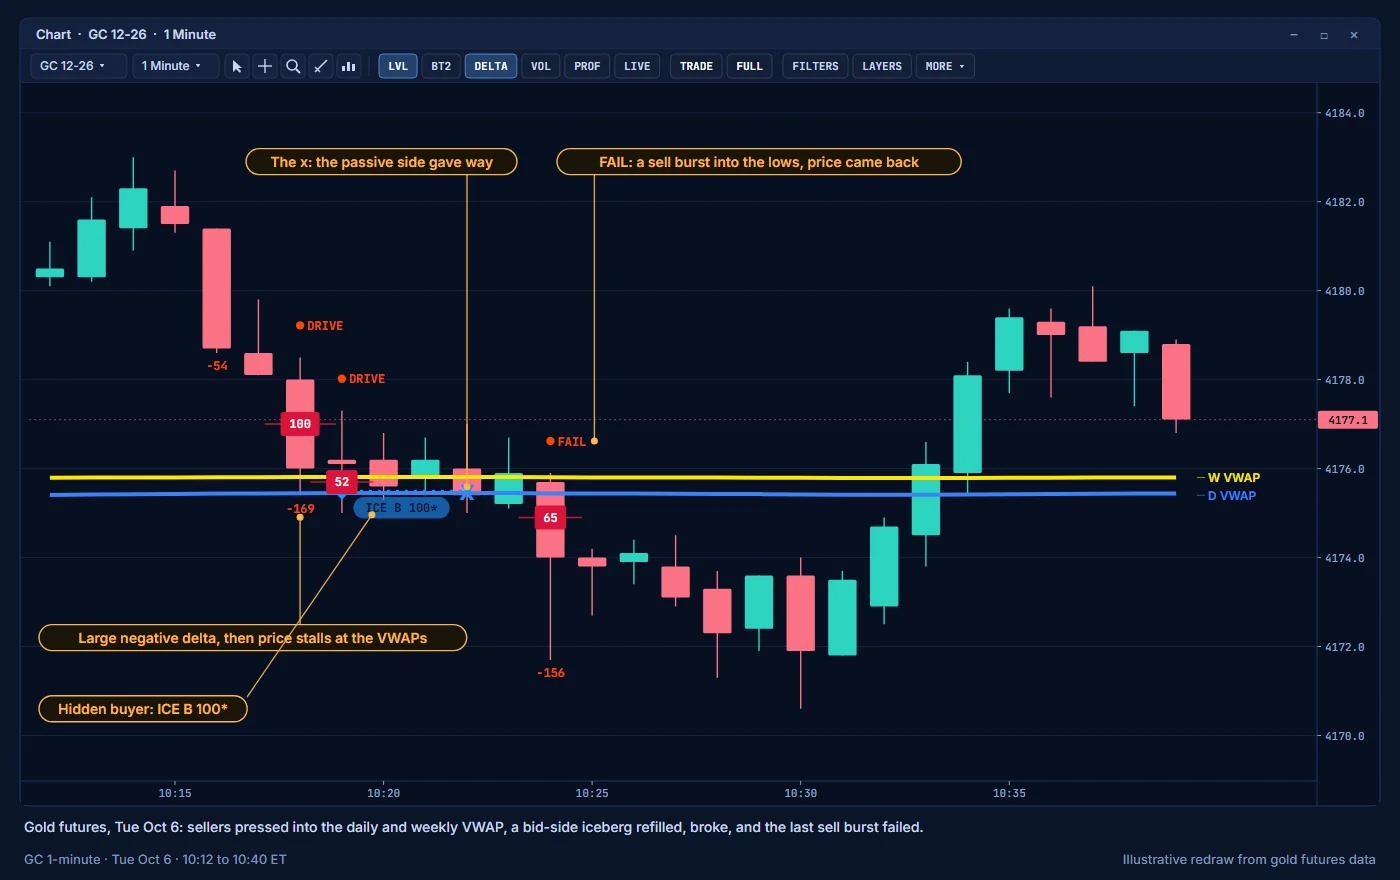
- Find the passive side. Check the map. Is there resting size at that price that stays, or refills, while it trades? Is there an iceberg line or an
ICEbadge? - Check the big orders. Are there big trade boxes into the level? Did they get a
FAILrole? - Read the context. What does the AUCTION row say? Absorption at the edge of a balance area is a different story from absorption against a strong trend.
- Watch what trades next. If the passive side holds, watch whether price stalls or turns. If the passive side breaks (an iceberg line turns dotted with an
x), the level gave way.
An illustrative example
The numbers below are illustrative, to show how the layers fit together.
Price rallies into yesterday's VAH, labeled PD VAH. The LOCATION row reads FIRST TOUCH. Over three candles, delta prints +150, +190 and +120, but each candle closes within a few ticks of the last. The candle volume filters show red tier 4 boxes on the right of the candles at the same price. A buy box of 85 lots appears and later gets a FAIL role. In the map, the ask at that price keeps showing size and gets an ABS badge, and an ICE S label appears.
What this describes: aggressive buyers spent a lot of effort at PD VAH, and a passive seller took it. The level to watch is PD VAH. What happens next is open. If buyers keep lifting and the iceberg line turns dotted, the seller is gone.
Common mistakes
- Reading one candle alone. One large delta is a data point. Several layers agreeing at a level is context.
- Ignoring location. The same delta means different things at a level and between levels.
- Treating absorption as a forecast. It describes who traded and who held. The next candles decide what it meant.
- Missing the data state. Without MBO data (
L2_FALLBACK), you will not see icebergs or order segments. Absorption can still show in delta, volume filters, big trades and event labels.
Related guides
Education only. Not financial advice. Trading futures and CFDs carries a high risk of loss.