Documentation menu
Replay: the gold drop of Oct 7, 2026
Step 1: the map before the moveStep 2: the breakStep 3: an iceberg that brokeStep 4: the low, at the D VALStep 5: the book at the lowWhat came nextThe lessonRelated guides
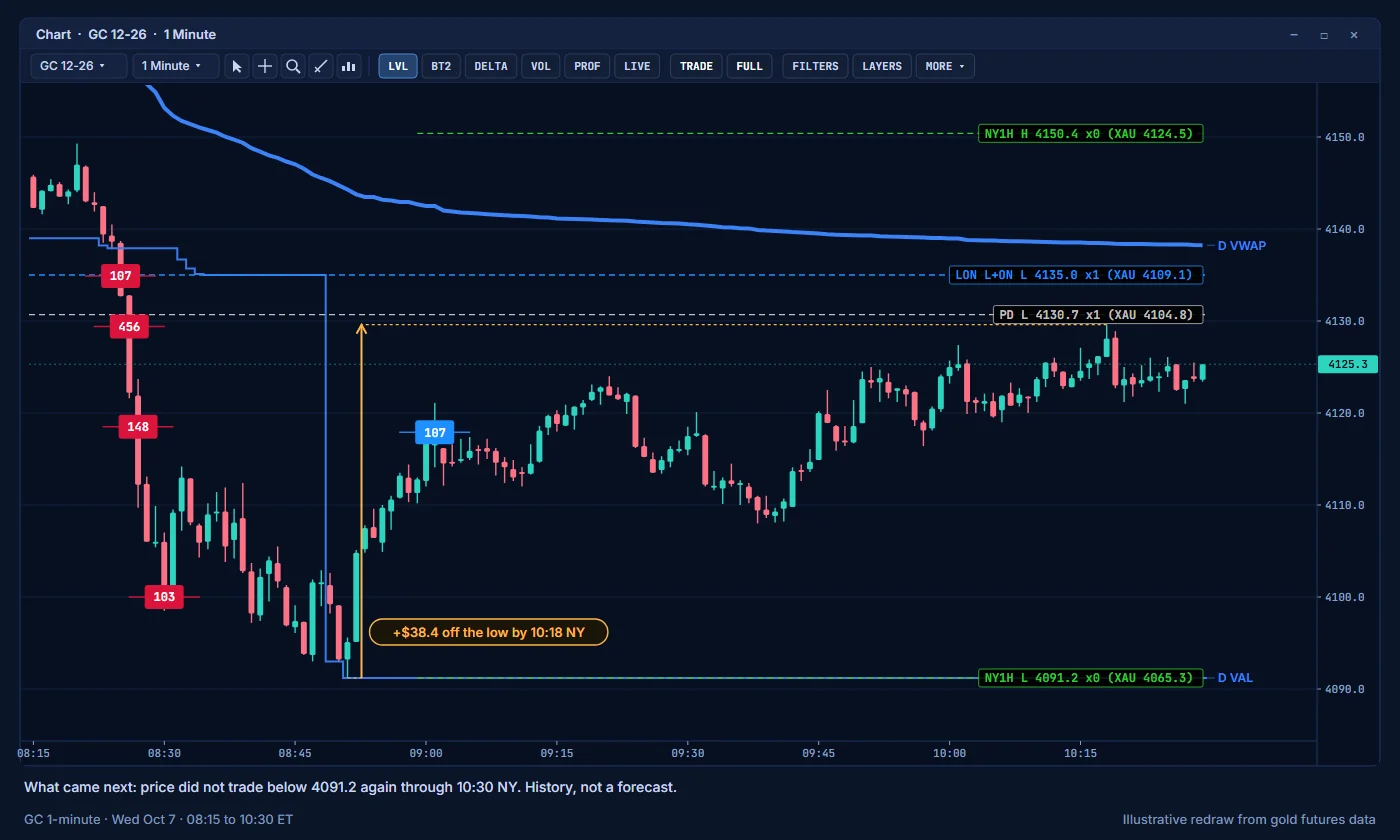
On Wednesday Oct 7, 2026, gold futures (GC) fell from 4149.3 to 4091.2 in 31 minutes, between 8:20 and 8:51 New York time (13:20 to 13:51 London). In XAUUSD terms that is about 4123 to 4067. This guide replays the move the way AK FlowBook draws it on NinjaTrader 8, layer by layer, from our own exchange data. It describes what happened. It does not say what happens next.
AK FlowBook for NinjaTrader 8 is built for traders with a full volume-trading setup: a strong PC, a few monitors, NinjaTrader with a futures feed, and a Rithmic connection for order-by-order data. If that is not your setup, AK FlowBook for TradingView works on the chart you already use.
All prices are GC futures. The XAUUSD equivalent in brackets uses the GC to XAUUSD basis measured at that moment (about -25.9 before the move, -24.2 at the low).
Step 1: the map before the move
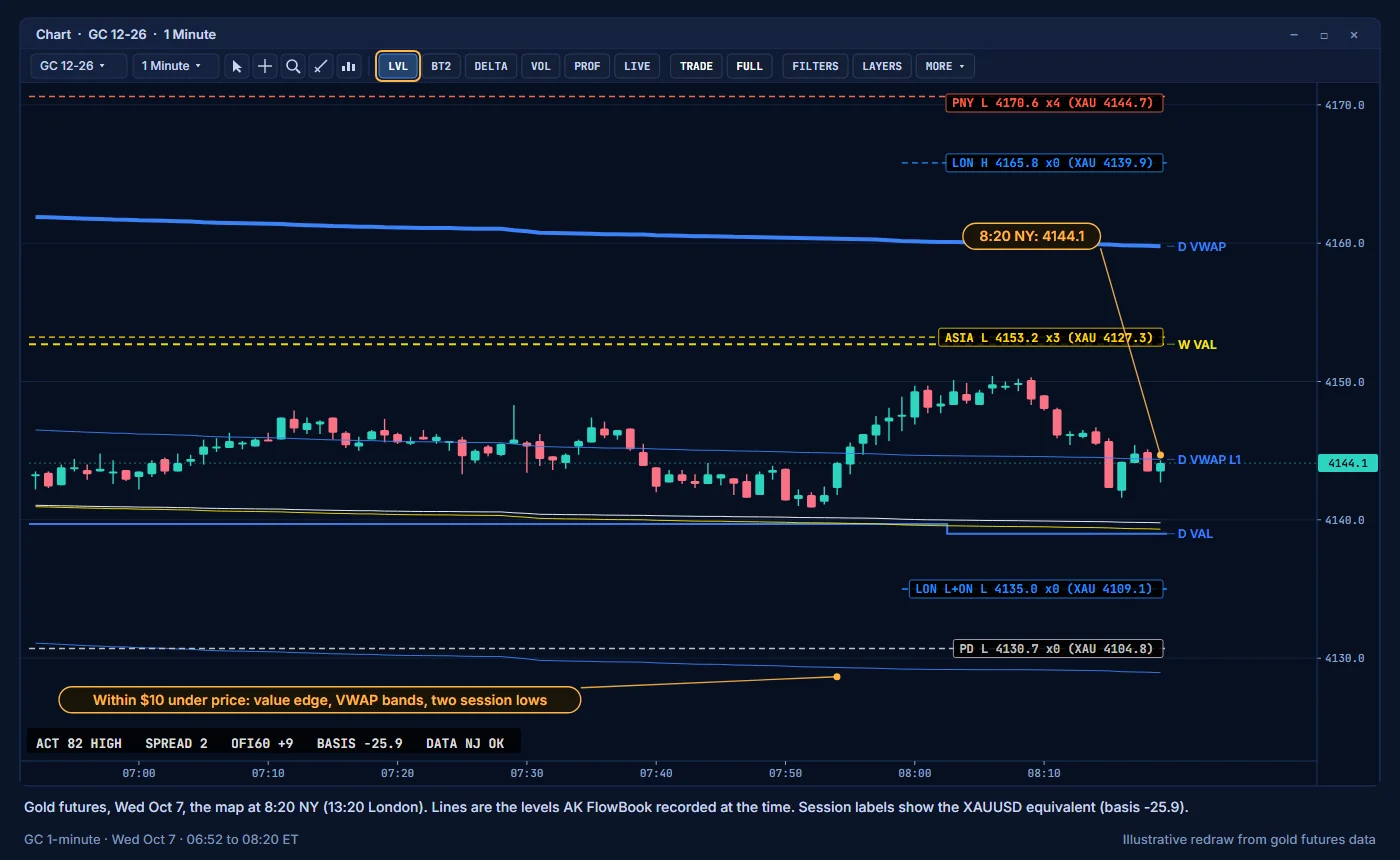
At 8:20 NY, GC traded at 4144.1. In the $15 below it, AK FlowBook had a cluster of levels:
| Level | GC | XAUUSD |
|---|---|---|
D VAL (developing) | 4139.0 | ≈4113 |
| Weekly and monthly VWAP lower 2σ bands | 4139.3, 4139.8 | ≈4113 |
LON L+ON L (London and overnight low) | 4135.0 | ≈4109 |
PD L (prior day low) | 4130.7 | ≈4105 |
| Daily VWAP lower 2σ band | 4129.0 | ≈4103 |
Below 4129.0 there was no AK FlowBook level for more than $60. A cluster like this is where order flow often gets busy, in either direction. See Session highs and lows as levels to watch.
Step 2: the break
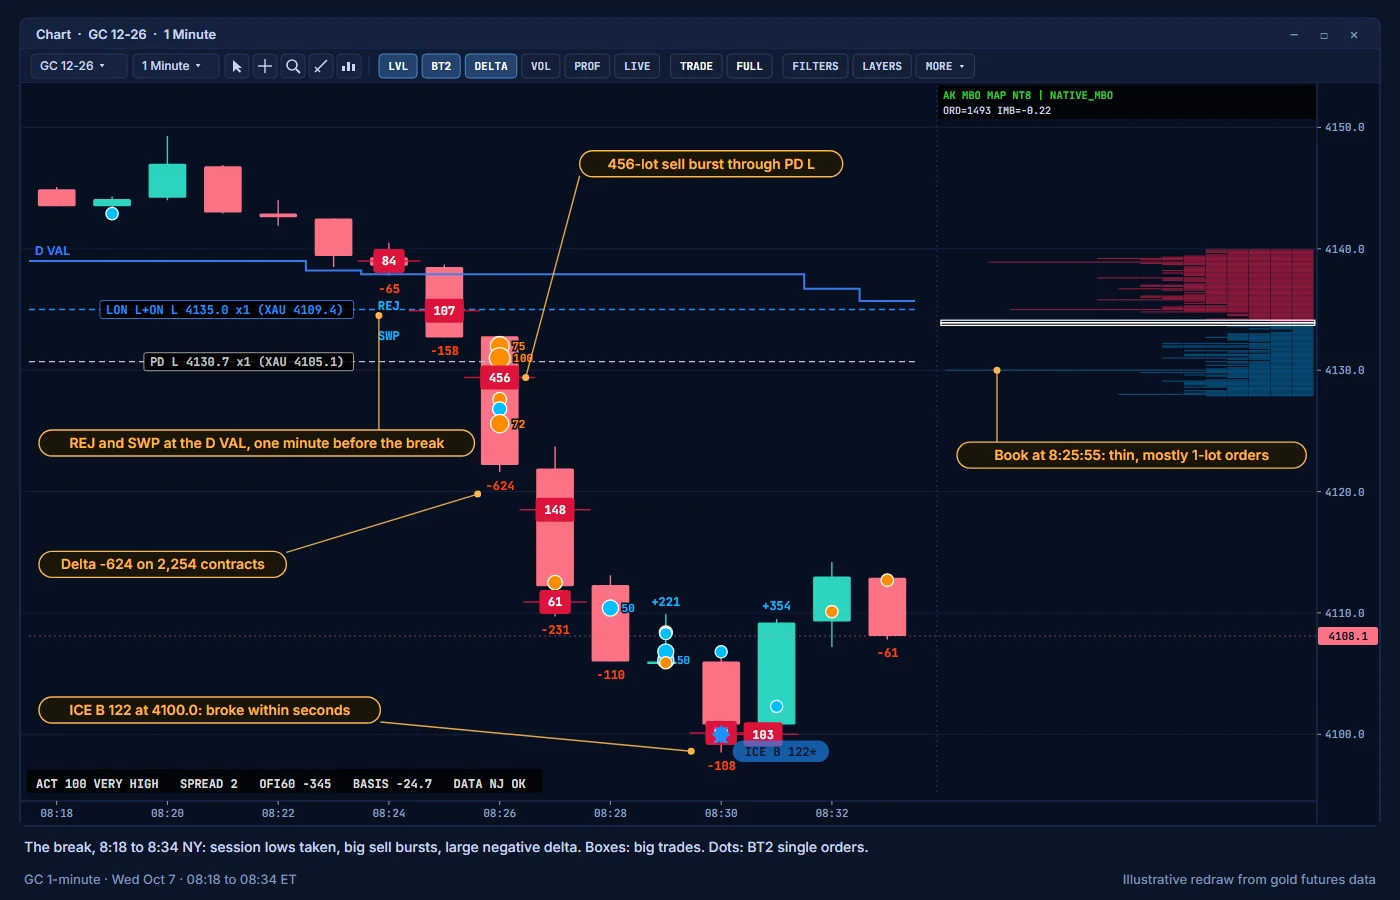
- 8:24: price touched the D VAL and AK FlowBook printed buy-side
REJandSWPlabels below the candle. One minute later that was history: labels describe what just happened, not what comes next. - 8:25: sellers took
LON L4135.0. Delta on that candle:-158. - 8:26:01: a 456-lot aggressive sell burst went through
PD L4130.7, sweeping more than $3 of price in about a second. It shows as a crimson big trade box. That candle printed-624delta on 2,254 contracts. - 8:27 and 8:28: delta
-231and-110, more sell bursts of 148 and 61 lots. Price followed the selling.
Here effort and result agreed: large negative delta and big sell bursts, and price fell more than $30 in four minutes.
Step 3: an iceberg that broke
At 8:30:30 the MBO price map showed 74 lots resting on the bid at 4100.0, including one single order of 64 lots. From 8:30:37, sellers hit that price with bursts of 98 and 103 lots, and a hidden buyer there took 122 lots while showing only 5 at a time: an iceberg, drawn as ICE B 122*.
At 8:30:55 price traded through 4100.0 and reached 4098.5 within seconds. The iceberg line turns thin and dotted and ends with an x: the passive buyer gave way. The next candle printed +354 delta and price jumped to 4109.5, but by 8:40 it was back under 4100.
Step 4: the low, at the D VAL
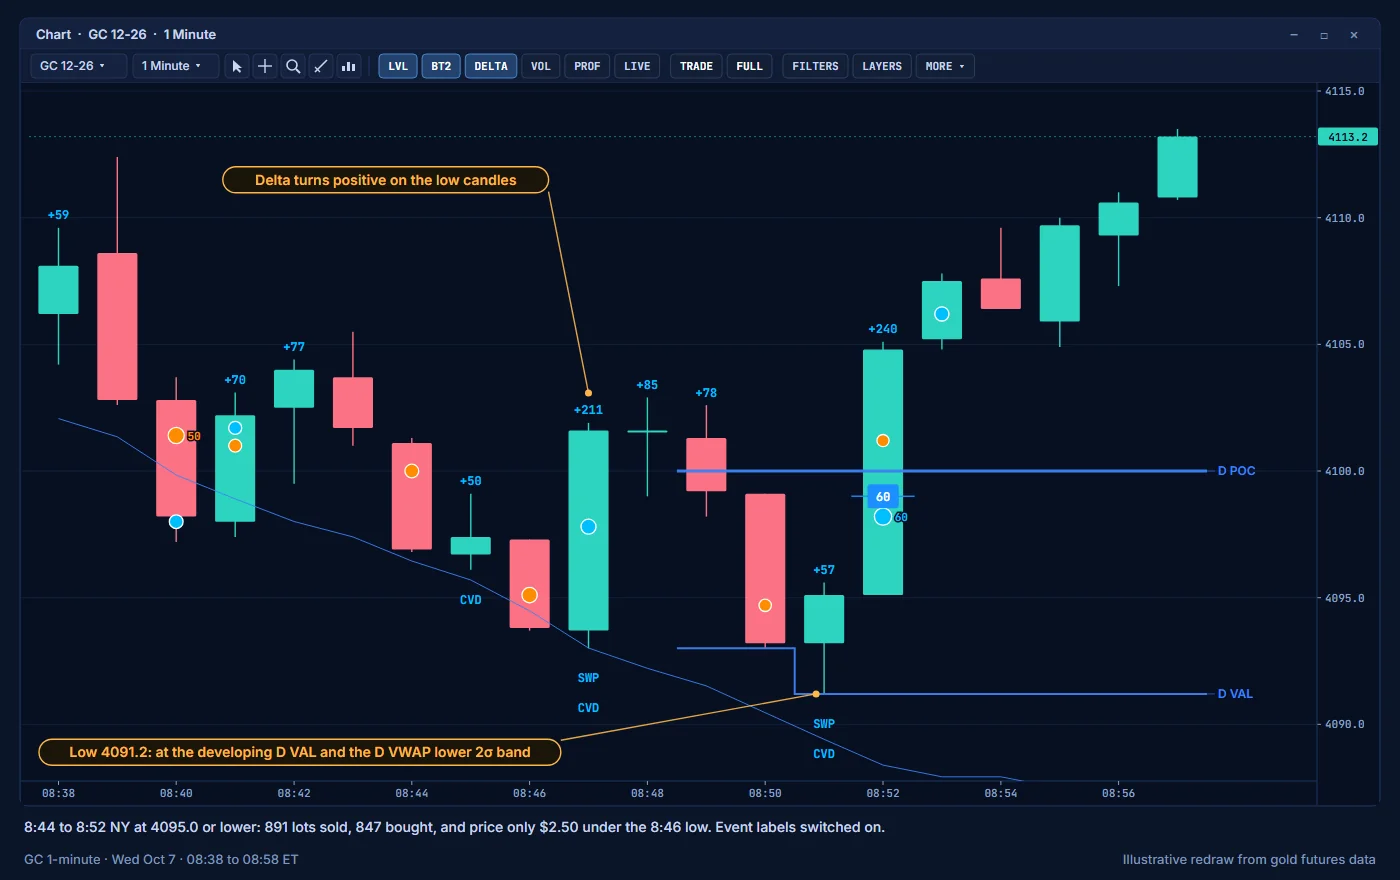
As the selling built volume at lower prices, the day's value area moved down with it. By 8:50 AK FlowBook's developing D VAL was 4093.0 (XAUUSD ≈4069) and the daily VWAP lower 2σ band was 4091.5. The low, 4091.2, printed at 8:51:30.
What the layers showed at the low:
| Layer | What it showed |
|---|---|
| Effort vs result | From 8:44 to 8:52, at 4095.0 or lower, sellers hit 891 lots and buyers lifted 847. Price went only $2.50 below the 8:46 low. |
| Delta | It turned positive on the low candles: +211, +57 (the low candle), then +240. |
| Cumulative delta | -1,274 at the 8:30 low, -243 at the lower 8:51 low: price lower, cumulative delta higher. AK FlowBook printed CVD (divergence) and SWP labels below those candles. |
| Big trades | No big sell burst at the low. The first big trade after it was a buy burst of 60 lots near 4099.0, at 8:52:16. |
| Icebergs | None detected at the low. |
This is what absorption can look like without an iceberg: steady selling that stops producing progress at a level. See Reading absorption for the full checklist.
Step 5: the book at the low
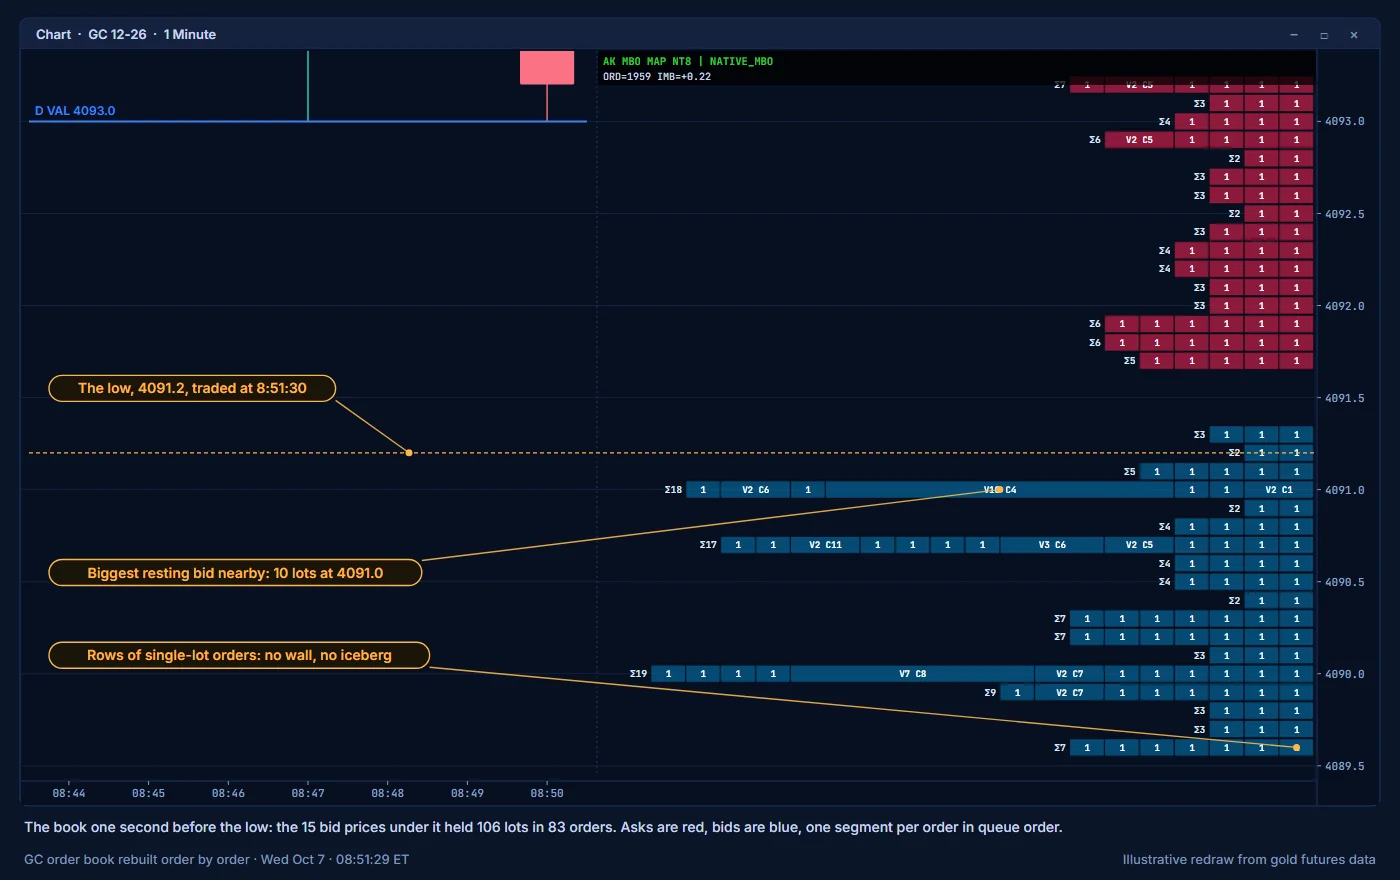
One second before the low, the map showed no wall and no iceberg. The 15 bid prices under the best bid held 106 lots in 83 orders, 74 of them single lots. The biggest resting bid nearby was 10 lots at 4091.0. The top ten bid prices held a little more size than the top ten asks (IMB=+0.22), but nothing stood out.
So the buyers who met the selling were not one large visible order. The low came from aggressive buying matching aggressive selling, in a thin book, at a value edge.
What came next
Price did not trade below 4091.2 again through 10:30 NY, when this replay was built. The rebound reached 4129.6 at 10:18 NY, $38.40 off the low, about 66% of the drop. At 10:15 NY (15:15 London) GC was 4124.6, about 4099 in XAUUSD.
None of that was known at 8:51. The same picture at a level can come before a bounce or before the next leg down.
The lesson
- Levels first. Before the move, a cluster of session lows and value edges sat under price. That told you where to watch, not which way.
- Effort vs result. At the break, large negative delta and big sell bursts moved price fast. At the D VAL, similar selling barely moved it.
- Say what you see. The iceberg at 4100.0 broke. The low had no iceberg and no wall. It had delta turning positive, a cumulative delta divergence and a thin book. Read the layers that are there, not the ones you expect.
Related guides
- Reading absorption
- Session highs and lows as levels to watch
- Delta, Big trades, Icebergs, MBO Price Map
Education only. Not financial advice. Trading futures and CFDs carries a high risk of loss.