Documentation menu
Dashboard: every row explained
RowsHeaderRow 1: Setup contextRow 2: Context biasRow 3: Score bull / bearRow 4: LocationRow 5: HTF / RegimeRow 6: IchimokuRow 7: FlowRow 8: Layers bull / bearRow 9: Δ~/Z • CVD~Row 10: Naked ↑ / ↓Row 11: MTFRow 12: PD zone / SessionTips
The dashboard is the table in the top-right corner of the chart. It summarizes the current bar in 13 rows: what the setup engine sees, the context around it and the nearest levels. It updates on every tick of the last bar. Turn it off with Decision dashboard in the Quick Start / Display group.
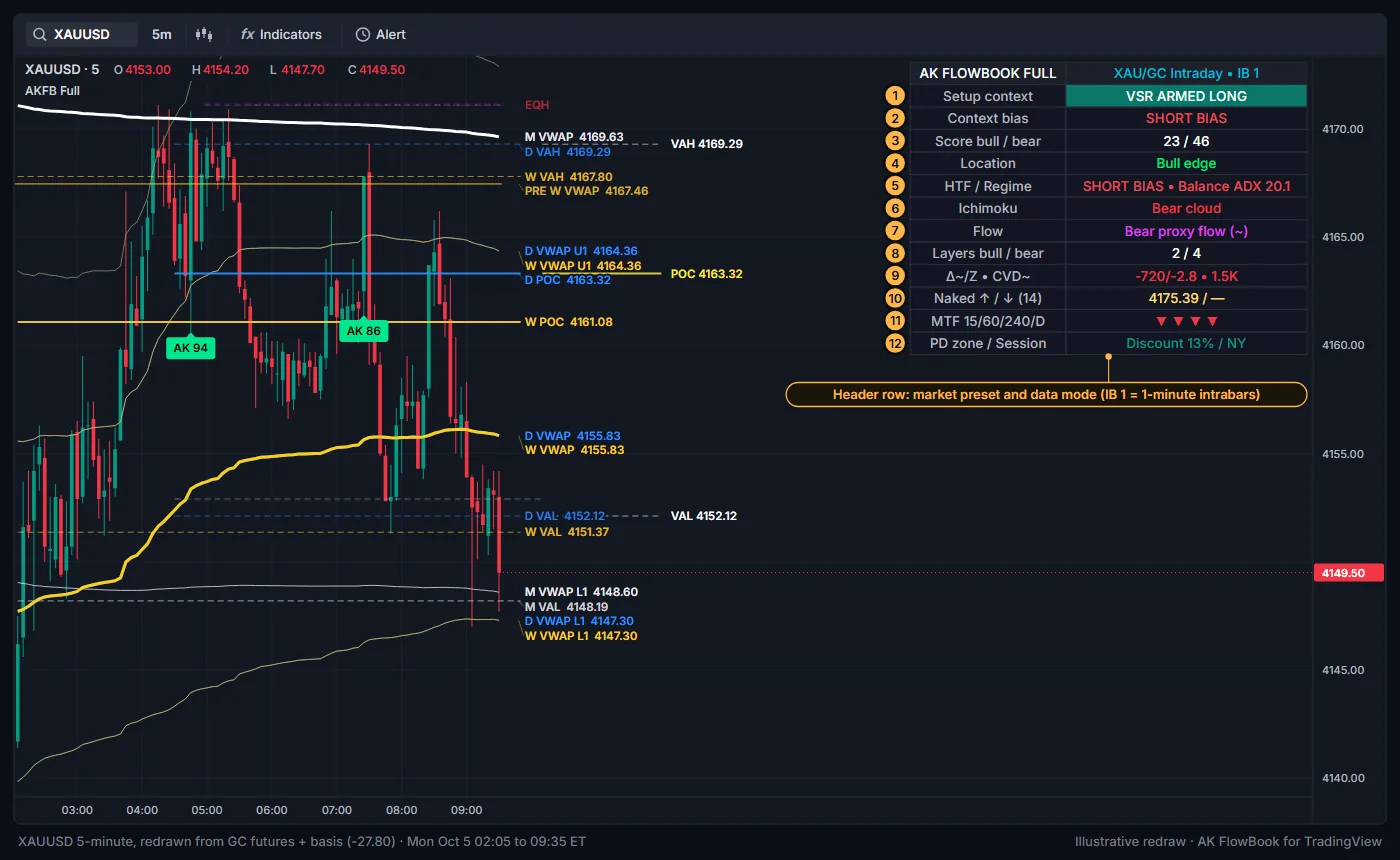
Rows
| Row | Left cell | Right cell | Colors |
|---|---|---|---|
| Header | AK FLOWBOOK FULL | Market preset and data mode, for example XAU/GC Intraday • IB 1 | Aqua when in scope with intrabars, orange otherwise |
| 1 | Setup context | Setup state on this bar | Green, red, teal, orange or grey background |
| 2 | Context bias | LONG BIAS, SHORT BIAS or NEUTRAL | Green, red or grey |
| 3 | Score bull / bear | Long-side score and short-side score, 0 to 100 | White |
| 4 | Location | Which side of a level price is at | Green, red or orange |
| 5 | HTF / Regime | HTF trend plus regime text | Green, red or grey |
| 6 | Ichimoku | Cloud context | Green, red or silver |
| 7 | Flow | Flow estimate state | Aqua, fuchsia or silver |
| 8 | Layers bull / bear | Agreeing layers per side, 0 to 7 | White |
| 9 | Δ~/Z • CVD~ | Bar delta estimate, its Z-score and CVD | Green if bar delta is zero or positive, red if negative |
| 10 | Naked ↑ / ↓ (<count>) | Nearest naked level above and below | Yellow |
| 11 | MTF 15/60/240/D | Four direction arrows | Green, red or grey |
| 12 | PD zone / Session | Premium/discount position and active session | Teal, red or silver |
Header
- Left:
AK FLOWBOOK FULL. When the last bar has no intrabar data,(pre-IB data)is added. - Right: the active market preset and the data mode.
IB 1means 1-minute intrabars are in use (the number is the intrabar timeframe).PROXYmeans no intrabars are available and flow values use the bar-only fallback.CHECK XAU/GC • 5mmeans the chart is outside the XAUUSD/GC 5-minute scope whileLimit setup markers to XAU/GC 5-minuteis on; setup markers will not appear.
Row 1: Setup context
| Value | Meaning |
|---|---|
<family> LONG SETUP, for example VSR LONG SETUP | A long-side setup context marker printed on this bar. Green. |
<family> SHORT SETUP | A short-side setup context marker printed on this bar. Red. |
<family> ARMED LONG | A long-side setup is armed and waiting for a reaction. Teal. |
<family> ARMED SHORT | A short-side setup is armed and waiting for a reaction. Orange. |
NO SETUP | Nothing active. Grey. |
Families are VSR, MIT, 3DP and FRR. See Setup context. This row describes the engine's state, not a recommendation.
Row 2: Context bias
Compares the long-side and short-side scores of the current bar. LONG BIAS when the long-side score is clearly higher, SHORT BIAS when the short-side score is clearly higher, NEUTRAL otherwise. It is a one-bar reading and changes often.
Row 3: Score bull / bear
The two confluence scores (0 to 100) for the current bar, long side first. A score near zero on both sides is normal away from levels.
Row 4: Location
| Value | Meaning |
|---|---|
Bull edge | Price is touching a lower reference level (long-side location). |
Bull edge • FIRST | Same, and it is the first return to the level after price traveled away. |
Bear edge | Price is touching an upper reference level. |
Bear edge • FIRST | Same, first return. |
Mid-air / no edge | Price is not at any tracked level. |
Row 5: HTF / Regime
The higher-timeframe trend (LONG BIAS, SHORT BIAS or NEUTRAL, from Trend timeframe) followed by the regime text, for example LONG BIAS • Trend ADX 25.3 or NEUTRAL • Balance ADX 18.1. See Higher-timeframe context.
Row 6: Ichimoku
Bull cloud, Bear cloud, Inside / mixed, or Disabled when Enable Ichimoku context is off.
Row 7: Flow
Bull proxy flow (~) or Bear proxy flow (~) when one of the flow events (delta, big volume, absorption, divergences, exhaustion and similar) points that way on the current bar; No proxy impulse (~) otherwise.
Row 8: Layers bull / bear
How many independent layers agree for each side, out of 7: setup, reaction, flow, structure, higher-timeframe trend, a cluster of levels, Ichimoku.
Row 9: Δ~/Z • CVD~
Three estimates, for example 1.2K/1.4 • -3.5K:
- bar delta estimate (up-bar minus down-bar volume of the current bar),
- its Z-score (how unusual it is compared with recent bars),
- CVD estimate. With
CVD anchor (dashboard)set to Session (default), CVD resets at each new trading day of the symbol; Continuous never resets.
Row 10: Naked ↑ / ↓
Nearest naked level above price, then below, and how many naked levels are stored. A dash means there is none on that side. See Naked levels.
Row 11: MTF
The left cell lists your four MTF timeframes. The right cell shows ▲, ▼ or ─ for each. Green when at least two more timeframes point up than down, red in the opposite case, grey otherwise.
Row 12: PD zone / Session
- Premium/discount:
Discount 23%,Premium 78%orEQ 51%(position inside the last swing range). A dash means no valid range yet. - Active session window:
NY,LDN,ASIAoroff-KZ.
Tips
- If the dashboard covers price, scroll the chart or use TradingView's chart scaling. You can also turn it off and rely on the right-side labels.
- The dashboard always describes the last bar. To study an older bar, use the markers and labels on the chart.
Education only. Not financial advice. Trading futures and CFDs carries a high risk of loss.