Documentation menu
Footprint panel (developing bar)
The footprint panel is a small table that shows where inside the current, still-forming bar the volume traded, split into estimated down-bar and up-bar volume at each price.
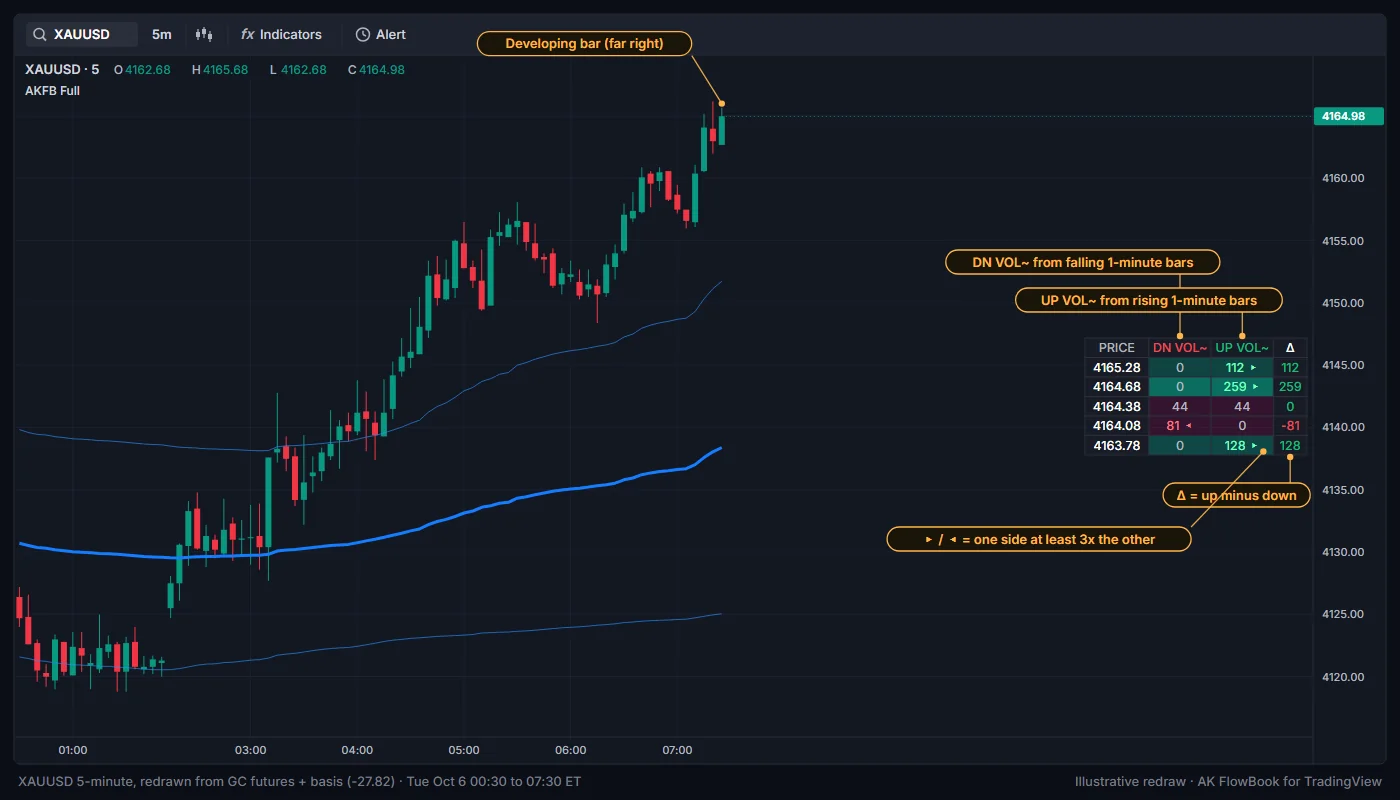
Where it is
By default the panel sits at the middle right of the chart (Panel position: Right). Set it to Left if it covers price. It shows only the developing bar, the one on the far right. It is rebuilt on every update.
Columns
| Column | What it shows |
|---|---|
PRICE | The price row (bin). Rows run from the highest price at the top to the lowest at the bottom. |
DN VOL~ | Estimated volume from falling 1-minute bars in that row. Shows ◂ and pink text when it is at least Imbalance ratio (up:down volume) times the up volume. |
UP VOL~ | Estimated volume from rising 1-minute bars in that row. Shows ▸ and green text when it is at least that ratio times the down volume. |
Δ | Up volume minus down volume for the row. Green when zero or positive, red when negative. |
Volumes use K, M and B for thousands, millions and billions.
Row background: teal when up volume is larger, maroon when down volume is larger. The stronger the color, the more volume the row holds compared with the busiest row of the bar.
How it is built
The panel uses the same engine as the other flow estimates (see Intrabar flow estimates): each 1-minute bar's volume is placed at its middle price and counted as up or down volume depending on how that 1-minute bar closed. The row height comes from Footprint bin size:
- Auto (ATR) (default): a fraction of the average true range, set by
Auto bin size (ATR fraction)(0.08), rounded to the symbol's tick. - Manual ticks: a fixed number of ticks per row (
Manual ticks per bin, 4).
Limits
- It is an estimate from 1-minute bars, not a real bid/ask footprint. A 5-minute bar has at most five 1-minute bars inside it, so the panel often has only a few rows.
- When the bar has more rows than
Panel rows(12 by default), the lowest-priced rows are cut off. If the current price is near the bottom of a tall bar, it may be off the panel. RaisePanel rows(up to 20) or the bin size if that happens. - If the current bar has no intrabar data, the panel stays empty.
How to read it
- Look for where volume concentrated inside the bar: near the high, near the low or in the middle.
- Arrows show rows where one side dominated by the imbalance ratio.
- Compare the
Δcolumn with where the bar is closing. Heavy down volume at the low with price closing back up is the kind of picture theA~absorption marker looks for.
Settings
| Setting | Default | What it does |
|---|---|---|
Show developing-bar footprint panel | On | Shows the panel. |
Panel rows | 12 | Maximum rows shown (6 to 20). |
Panel position | Right | Middle right or middle left of the chart. |
Footprint bin size | Auto (ATR) | How the row height is set. |
Manual ticks per bin | 4 | Row height in ticks when the bin size is Manual ticks. |
Auto bin size (ATR fraction) | 0.08 | Row height as a fraction of ATR when the bin size is Auto. |
Imbalance ratio (up:down volume) | 3.0 | Ratio that triggers the arrows (also used for imbalance zones). |
Education only. Not financial advice. Trading futures and CFDs carries a high risk of loss.