Documentation menu
Guide: reading absorption (A~) at a level
The ideaWhat A~ checksStep 1: check the locationStep 2: check the bar itselfStep 3: watch the next barsWhere the estimate can mislead
Absorption is one of the most useful ideas in order flow: one side pushes hard, and the other side quietly takes everything without letting price move. This guide explains how AK FlowBook estimates it on TradingView and how to read it without over-reading it.
The idea
On a real order book, absorption means aggressive orders hit a price level and a large passive order soaks them up. Volume is high, but price does not move through. Effort without result.
TradingView cannot see passive orders or the bid and ask. AK FlowBook looks for the footprint absorption leaves in bar data instead.
What A~ checks
The A~ marker is drawn on a bar with intrabar data when all of these are true (green diamond below the bar for the long side, orange above for the short side):
- High volume. Bar volume is unusually high for recent bars (
Absorption volume Z, 1.4). - Small body. The body is small compared with the range (
Max body/range, 0.30). Lots of effort, little net progress. - Volume at one end. A large share of the bar's volume traded in its lowest part for a long-side
A~, or its highest part for a short-side one (Absorption edge volume %, 30). - Pressure into that end. Inside the bar, the 1-minute delta estimate pushed clearly toward that end. For the long side: sellers were pressing down.
- Close away from it. Despite that pressure, the bar closed in its upper part (long side) or lower part (short side).
Put together: heavy selling pressure at the low of the bar, and price still closed up. Someone absorbed the selling. The short-side marker is the mirror.
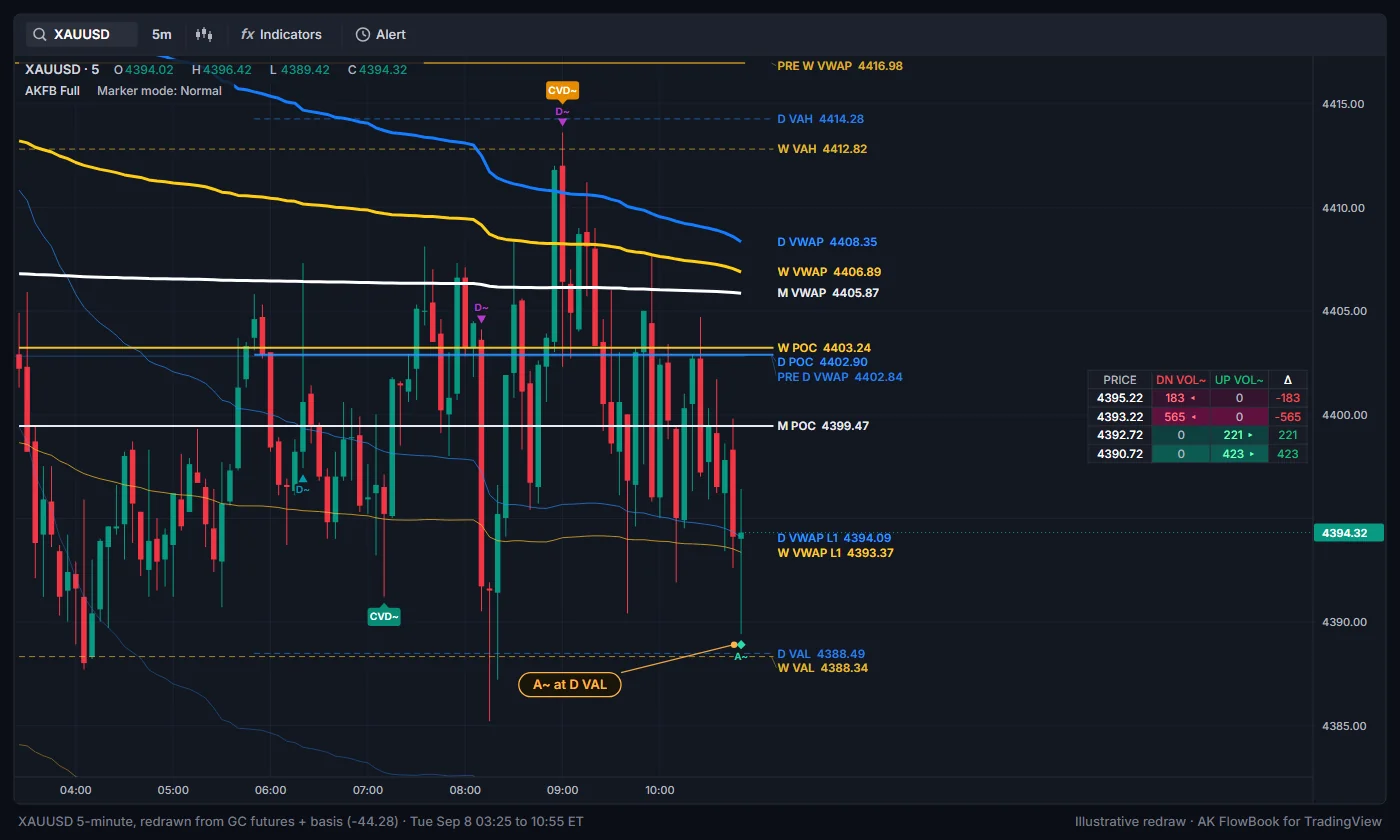
To see A~, switch Marker mode to Normal or turn on Show enabled events in Elite mode too. See Display and marker modes.
Step 1: check the location
Absorption matters most where it happens. Before reading the marker, ask:
- Is the bar at a level? Check the dashboard
Locationrow, or look for VAL/VAH, a naked level, the prior day high or low, a VWAP band or a zone. - Which level is it? A weekly VAL is a bigger reference than a minor swing.
An A~ in the middle of the range, away from any reference, is weak information.
Step 2: check the bar itself
- Open the footprint panel on the live bar, or look at the closed bar's shape: long lower wick, small body, close in the upper part.
- Look at the dashboard
Δ~/Z • CVD~row for the delta estimate of the last bar. - Was the level pierced? An
SWPsweep mark or anLQsweep on the same bar adds a liquidity story: stops below were taken and the selling was absorbed.
Step 3: watch the next bars
Absorption is a single bar. What comes next decides whether it mattered:
- Follow-through: the next bars hold above the absorption bar's low and volume picks up on the way up. The absorbing side is in control for now.
- Failure: price trades back through the absorption bar's low with volume. The passive side gave up; the original pressure won.
- Nothing: price drifts. The level is still a reference, but the absorption did not change much.
The CVD~ divergence marker can add to the picture: a lower price low with a higher CVD low near the same level tells a similar effort-versus-result story over several bars.
Where the estimate can mislead
- It is a proxy. Up-bar and down-bar volume of 1-minute bars is not bid and ask volume. A falling 1-minute bar can contain plenty of buying.
- Only bars with intrabar data. On older history without 1-minute data,
A~is switched off. - The live bar.
A~is evaluated on every update and can appear and disappear before the bar closes. Read it on closed bars. - Feed differences. CFD and futures volume differ, so
A~may show on one chart and not the other. - News and thin markets. Around news releases or in very quiet hours, volume behaves unusually and the estimate is less reliable.
A~ side, what the next five bars did. After a few weeks you will know how the marker behaves on your feed and timeframe. That is your own research, not a promise of future behavior.For the real thing (passive orders, icebergs and absorption seen in the order book), see AK FlowBook for NinjaTrader.
Education only. Not financial advice. Trading futures and CFDs carries a high risk of loss.