Documentation menu
Volume profiles: POC, VAH and VAL (D/W/M)
The three key levelsHow the profile is estimatedWhat is drawnHigh- and low-volume areasHow to read itSettings
A volume profile shows how much volume traded at each price during a period. AK FlowBook builds three profiles at the same time (day, week and month) and draws their key levels on your chart.
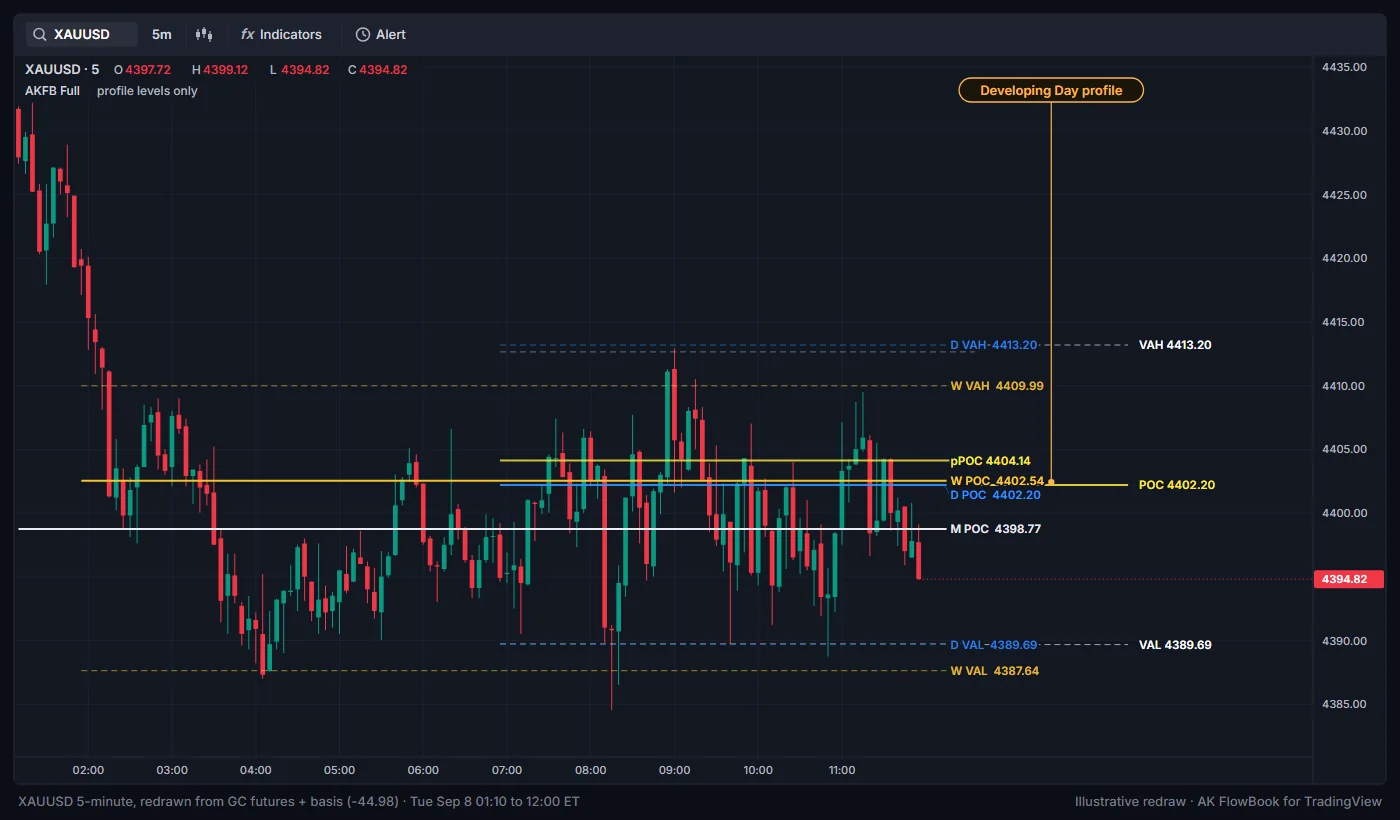
The three key levels
- POC (point of control): the price with the most volume in the period.
- VAH (value area high) and VAL (value area low): the top and bottom of the value area, the price range that holds 70% of the period's volume by default (
Value area %).
The value area is built by starting at the POC and adding the busier neighboring price row, one row at a time, until the target share of volume is reached.
How the profile is estimated
TradingView does not give scripts tick-by-tick trades, so the profile is an estimate:
- For each chart bar, the indicator reads the 1-minute bars inside it (on charts up to 1 hour).
- Each 1-minute bar's volume is placed at that bar's middle price, in a price row.
- The rows add up into the day, week and month profiles. Each period uses a fixed row height set at its start, taller for the week and the month.
- On older bars where TradingView has no intrabar history, the bar's volume is spread evenly across its high-to-low range. Profiles in that part of history are coarser.
Because of this, the levels can differ slightly from a tick-based profile on another platform, and they differ between a CFD feed and futures. See Intrabar flow estimates.
What is drawn
D/W/M level lines (registry)
With Show D/W/M POC-VAH-VAL registry on, the developing POC, VAH and VAL of the current day, week and month are drawn as lines that start a little to the left of the last bar and run to the right-side labels:
| Period | Color | POC | VAH and VAL |
|---|---|---|---|
| Day | Blue | Solid, thicker | Dashed |
| Week | Gold | Solid, thicker | Dashed |
| Month | Light grey | Solid, thicker | Dashed |
Right labels: D POC, D VAH, D VAL, W POC, W VAH, W VAL, M POC, M VAH, M VAL, with prices when Include prices in labels is on.
Developing profile at the right edge
To the right of the last bar the indicator draws the profile chosen in Rendered profile period (Day by default):
- a yellow line labelled
POC <price>, - white dashed lines labelled
VAH <price>andVAL <price>, - the prior period's levels for the same profile type: a yellow line labelled
pPOC <price>and silver dashed lines for the prior VAH and VAL (these two have no text).
Optional histogram
Turn on Histogram rows (volume bars) to draw the profile itself:
- The POC row is yellow, rows inside the value area are aqua, rows outside it are grey.
- A second, shorter bar on each row shows the difference between up-bar and down-bar volume at that price: teal when up-bar volume is larger, maroon when down-bar volume is larger.
- The histogram is compressed to at most
Max profile rowsrows (36 by default).
High- and low-volume areas
AK FlowBook does not label HVN or LVN levels separately. With the histogram on you can read them directly: wide rows are high-volume areas where the market spent time and accepted price; thin rows are low-volume areas that price moved through quickly. Many auction traders watch thin areas as places price can travel through fast, and wide areas as places where it tends to slow down. That is a way of reading the profile, not a rule.
How to read it
- Inside value (between VAL and VAH): the market is trading where most volume was accepted. Two-sided trade is common there.
- Outside value: price is testing prices the market has not accepted yet. Watch whether volume builds there (acceptance) or price returns to value (rejection). One wick through VAH or VAL is not acceptance; time and volume are.
- POC: the fairest price of the period so far. The developing POC can move during the period.
- Prior period levels: yesterday's (or last week's) POC, VAH and VAL are common reference points for today's trade. When a period closes, its levels can also become naked levels.
Show session volume profile draws calendar day, week and month profiles that follow the symbol's TradingView sessions. It is not a separate session (Asia, London, New York) profile.Settings
| Setting | Default | What it does |
|---|---|---|
Show session volume profile | On | Draws the developing profile levels and prior levels at the right edge. |
Histogram rows (volume bars) | Off | Draws the volume histogram. Off keeps only the named lines. |
Rendered profile period | Day | Which profile (Day, Week or Month) is drawn at the right edge. All three are always calculated. |
Show D/W/M POC-VAH-VAL registry | On | Draws the nine D/W/M POC, VAH and VAL lines and their right labels. |
Max profile rows | 36 | Maximum rows in the histogram. |
Value area % | 70 | Share of volume inside the value area. |
Profile width (bars) | 22 | Width of the right-edge profile. |
Profile right offset (bars) | 8 | Gap between the last bar and the profile. |
Show prior POC / VAH / VAL lines | On | Draws the prior period's POC (pPOC), VAH and VAL. |
Use POC / VA edges in setup engine | On | Lets the setup engine treat VAL, VAH and the prior POC as levels. |
The row height of the 1-minute footprint bins is set in the Intrabar Volume-Flow Proxy group (Footprint bin size, Manual ticks per bin, Auto bin size (ATR fraction)).
Education only. Not financial advice. Trading futures and CFDs carries a high risk of loss.