Documentation menu
Quick start: your first chart with AK FlowBook
Before you startStep 1: open the recommended chartStep 2: add the indicatorStep 3: keep the defaultsStep 4: what you see on first loadStep 5: the first five things to checkStep 6 (optional): show the flow markersNext steps
After this page you will have AK FlowBook Full running on a 5-minute gold chart with the recommended defaults, and you will know which five things to check first. Using Lite? The steps are the same; see the Lite guide for what Lite shows.
Before you start
- You need a TradingView account and access to the script. See Get access.
- Nothing in this guide is a recommendation to trade. The indicator shows levels and context; decisions stay yours.
Step 1: open the recommended chart
| Setting | Recommended | Why |
|---|---|---|
| Symbol | OANDA:XAUUSD (spot gold CFD) or COMEX:GC1! (gold futures, front month) | The indicator was built and tuned on gold. |
| Timeframe | 5 minutes | Setup context markers run on XAU/GC 5-minute by default. The liquidity layer needs a 1- to 5-minute chart. |
| Chart type | Standard candles or bars | Heikin Ashi, Renko and similar chart types change the price data the indicator reads. |
On a 5-minute chart the intrabar engine uses 1-minute bars inside each candle. It does that on any chart up to 1 hour. See Intrabar flow estimates.
Step 2: add the indicator
Open Indicators, go to Invite-only scripts and click AK FlowBook Full. It appears as AKFB Full on the price pane. It draws on the price chart itself; there is no separate pane.
Step 3: keep the defaults
The defaults are set for gold. Leave these as they are for your first session:
Market preset: XAU/GC Intraday. See Market presets.Display mode: Clean. See Display and marker modes.Marker mode: Elite. Small diagnostic markers stay hidden until you ask for them.Confirm on bar close: On. Setup markers are fixed when the bar closes.
Step 4: what you see on first load
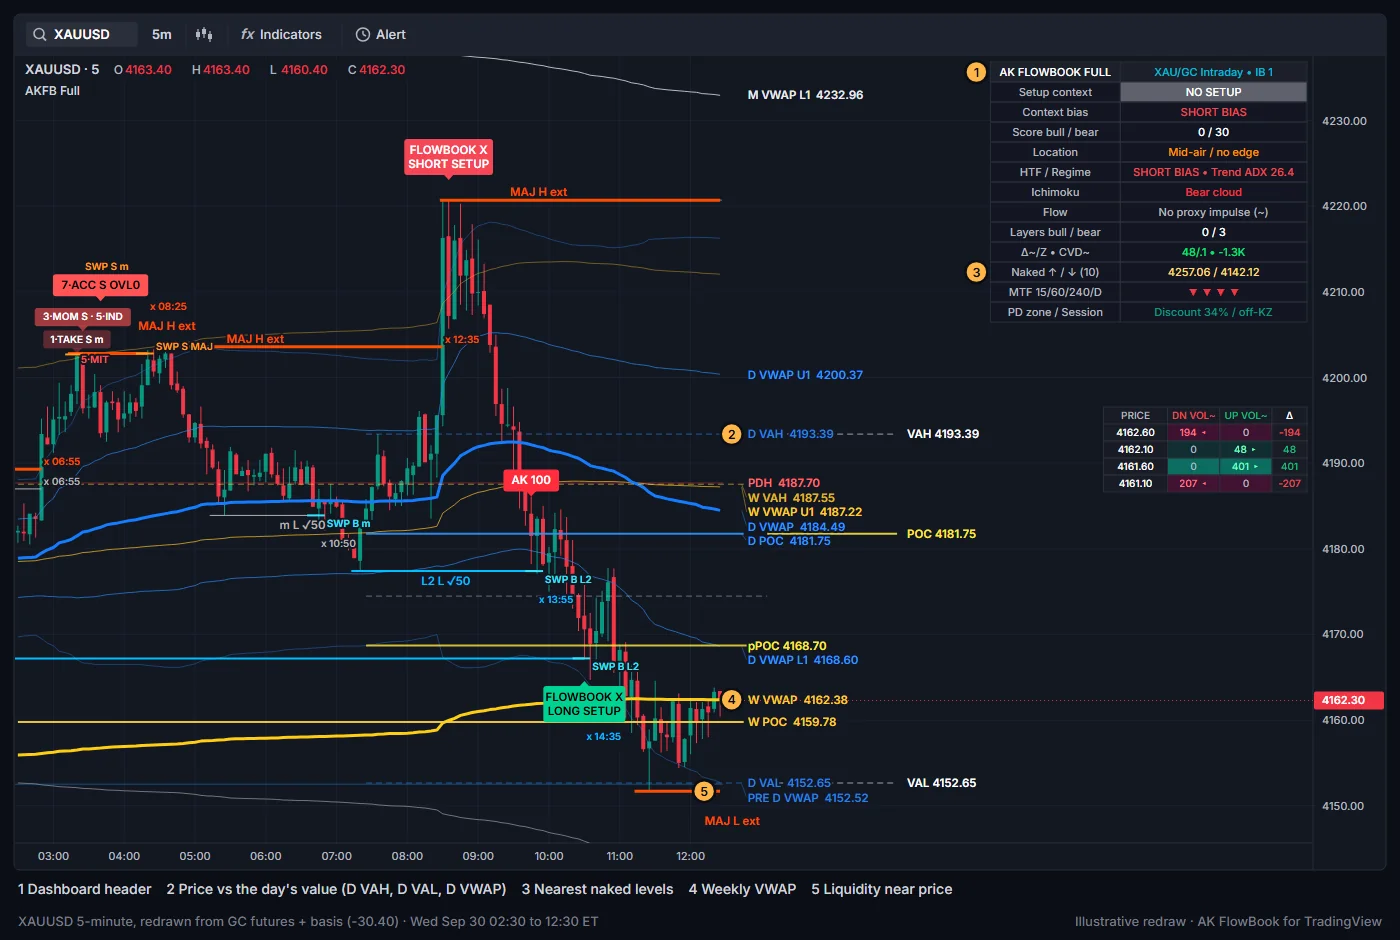
With the defaults, the chart shows the map first and only a few markers:
- Daily (blue), weekly (gold) and monthly (white) VWAP with their bands, the previous period's VWAP and the prior day's high and low.
- Daily, weekly and monthly POC, VAH and VAL lines, plus the developing profile levels at the right edge.
- Level names and prices at the right edge of the chart.
- Naked levels (
nPOC,nVAH,nVAL,nVWAP) that price has not revisited. EQHandEQLlines and the London and New York session high and low lines.- The 15-minute liquidity layer:
m,L2andMAJswing levels,xtake marks,SWPsweep marks,LQ-B*/LQ-S*labels and the origin chain labels. - The footprint panel (middle right) and the dashboard (top right).
- Top-tier
AKsetup context markers andFLOWBOOK Xmarkers, when their conditions occur.
Step 5: the first five things to check
- Dashboard header. The top-right cell should read
XAU/GC Intraday • IB 1.IB 1means 1-minute intrabars are in use. If you seePROXYorCHECK XAU/GC • 5m, read Troubleshooting. - Price versus the day's value. Is price above, inside or below the day's value area (
D VAHtoD VAL), and above or belowD VWAP? Inside value usually means two-sided, balanced trade. Trade away from value tells you the market is testing a new price area. - Nearest naked levels. The dashboard row
Naked ↑ / ↓shows the closest untested level above and below price. - The bigger picture. Where are
W VWAP,M VWAPand the weekly and monthly value areas? TheMTFrow shows the 15-minute, 1-hour, 4-hour and daily direction arrows. - Liquidity near price. Which session highs and lows,
EQH/EQLlines andMAJorL215-minute levels sit close to price? Those are the places where stops and resting orders often cluster.
Then watch what price does when it reaches one of those levels. That is where the flow estimates and the setup context markers become useful.
Step 6 (optional): show the flow markers
The flow markers (D~, BV~, A~, CVD~ and others) are hidden in Elite mode. To see them, do one of the following:
- set
Marker modeto Normal, or - turn on
Show enabled events in Elite mode tooin the Event Markers group.
See Display and marker modes for what each switch does.
Next steps
- Dashboard: every row explained.
- Your first session: a simple routine.
- Setup context: what the
AKscore labels mean and what they do not mean.
Education only. Not financial advice. Trading futures and CFDs carries a high risk of loss.