Documentation menu
AK FlowBook Lite: complete guide
AK FlowBook Lite (AKFB Lite on the chart) is the free build of AK FlowBook for TradingView. It maps where volume traded and how price behaves around those prices: daily, weekly and monthly VWAP, volume profile levels, naked levels, structure, liquidity, sessions and order-flow estimates. It shows no buy or sell signals, no stops and no targets.
To get it, see Get access. Lite is free for followers.
Data and limits
~.- Profiles are estimated from 1-minute bars and can differ slightly from a tick-based profile.
- Different feeds (CFD broker versus futures) report different volume, so levels can differ between XAUUSD providers and GC futures. See Futures levels on a CFD chart.
- Built and tuned on gold (XAUUSD and GC) on intraday charts. The levels work on any symbol with volume, on any intraday timeframe. Lite has no symbol or timeframe restriction.
Quick start
- Open
OANDA:XAUUSDorCOMEX:GC1!on 5 minutes. - Add AK FlowBook Lite from Indicators, Invite-only scripts.
- Keep the defaults:
Market presetXAU/GC Intraday,Display modeClean. - Check the dashboard header: it should read
XAU/GC Intraday • IB 1.
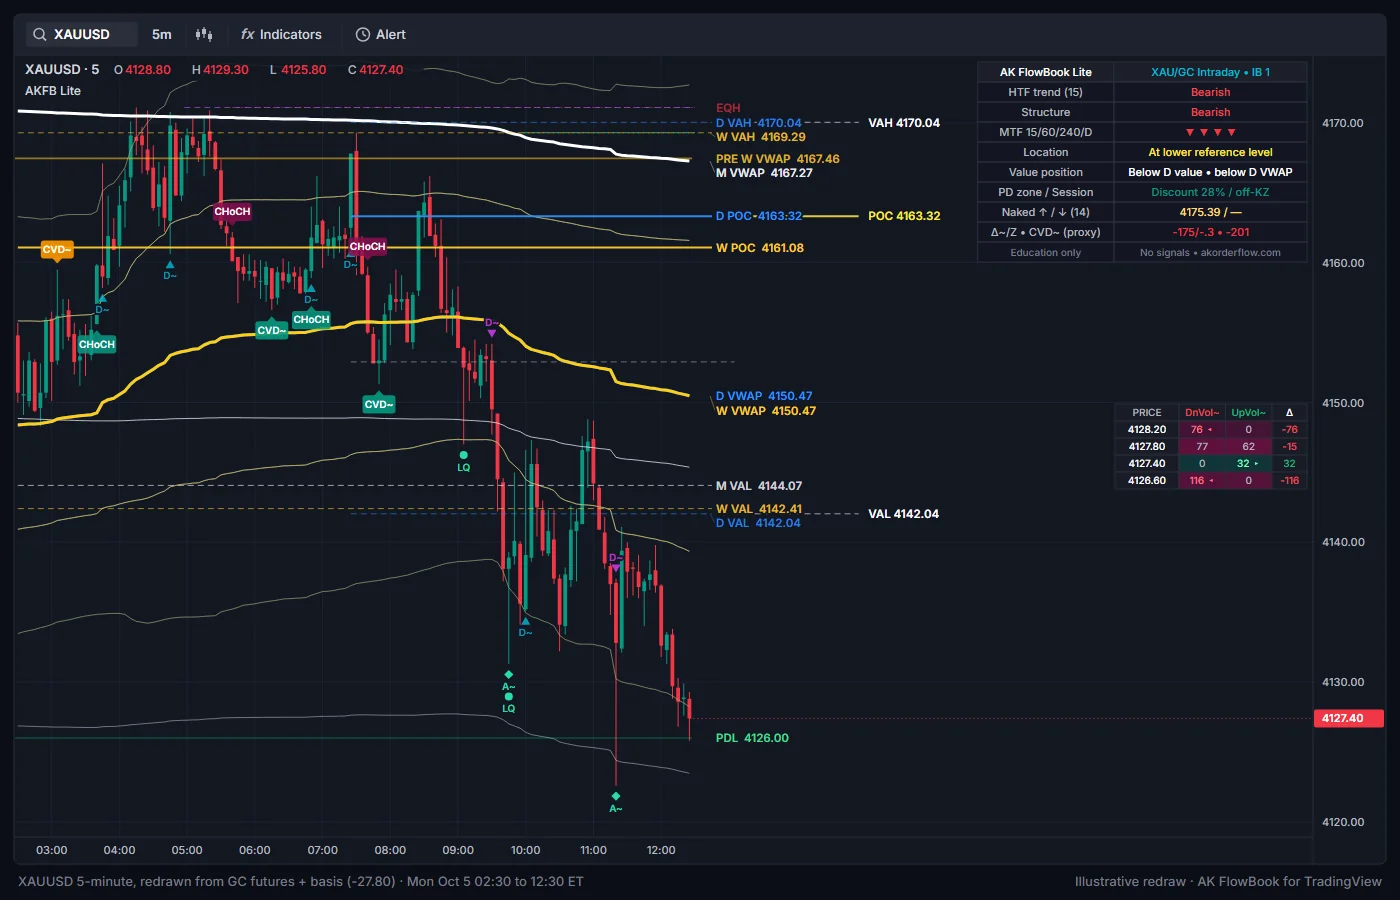
On first load (Clean) you see: D/W/M VWAP with bands, previous VWAPs, PDH/PDL, right-side labels, D/W/M POC/VAH/VAL lines, the developing profile levels, naked levels, EQH/EQL, London and New York session lines, the FlowBook panel and the dashboard. Markers on by default: D~ (near levels only), A~, CVD~, LQ and CHoCH.
What Lite shows
VWAP map
Daily (blue), weekly (gold) and monthly (white) VWAP with band 1 and band 2 (1σ and 2σ by default), the previous period's final VWAP as step lines, and prior day, week and month highs and lows. PWH/PWL are hidden in Clean display mode and PMH/PML show only in Full display mode. Details: VWAP map.
Right-side labels: D VWAP, W VWAP, M VWAP, PRE D VWAP, PRE W VWAP, PRE M VWAP, PDH, PDL (plus PWH, PWL, PMH, PML where shown), the nine D/W/M POC/VAH/VAL labels, and band 1 labels (D VWAP U1 and so on) if you turn on Band 1 levels (off by default in Lite).
Volume profiles
Day, week and month profiles are calculated at the same time. The nine D/W/M POC, VAH and VAL lines run to the right labels. At the right edge, the profile chosen in Rendered profile period shows POC, VAH, VAL with prices and the prior period's pPOC with prior VAH and VAL lines. An optional histogram (Histogram rows (volume bars), off) colors the POC row yellow and value-area rows aqua, with a second bar for up minus down volume. Details: Volume profiles.
Naked levels
nPOC (yellow), nVAH and nVAL (silver, dotted) and nVWAP (blue) from finished days, weeks and months, drawn until price trades through them. Details: Naked levels.
Flow estimates (~)
| Marker | Default | Meaning |
|---|---|---|
D~ (aqua triangle below, fuchsia above) | On, near levels only | Unusually large delta estimate on one side. |
BV~ (blue square below, red above) | Off | Unusually high volume with a directional close. |
A~ (green diamond below, orange above) | On | Absorption: heavy volume, small body, volume at one end and a close away from it. |
CVD~ (teal label below, orange above) | On | Price swing versus cumulative delta divergence, drawn back on the swing bar. |
Δ÷ (aqua label below, fuchsia above) | On, hidden in Clean | Price swing versus recent delta divergence. |
IMB~ (teal square below, maroon above) | On, hidden in Clean | A new stacked imbalance zone (several price rows with one side at least the imbalance ratio). |
EXH (orange label) | Off | New high with negative delta estimate, or new low with positive. |
• / ● bubbles | On, hidden in Clean | A single lower-timeframe bar with unusually large volume (● is at least twice the threshold). Not an exchange trade print. |
D~, BV~, A~ and CVD~ are evaluated on every update, so D~, BV~ and A~ can change on the live bar until it closes. The other markers follow Confirm markers on bar close. Flow markers and imbalance zones need intrabar data; on older history without it they are switched off. Details: Intrabar flow estimates.
FlowBook panel
The developing-bar footprint table at the middle right. Columns: PRICE, DnVol~ (down-bar volume), UpVol~ (up-bar volume) and Δ. Arrows ◂ and ▸ mark rows where one side is at least Imbalance ratio (up:down volume) times the other. Details: Footprint panel (the Full build labels the columns DN VOL~ and UP VOL~).
Structure
Lite tracks confirmed swing highs and lows and draws:
CHoCH(on): change of character, the first close through the opposite swing. Teal label below the bar for a break up, maroon above for a break down.BOS(off): break of structure, a close through the last swing in the direction of the existing structure. Grey labels.
Both are fixed at bar close by default and appear only after the swing has been confirmed. The dashboard Structure row shows the direction of the last break.
Liquidity
EQH/EQL: equal highs and lows, dotted lines until price trades through them.LQ(on): a sweep of recent highs or lows with a close back, enough volume, wick and reclaim. Green circle below, red above.SFP(off): failed break of the last swing high or low.
Details: Liquidity (the 15-minute liquidity layer described there is Full only).
Zones
Fair-value gaps, order blocks and breaker blocks are tracked for the dashboard and the D~ location filter. Their boxes are off by default (Show FVG zones, Show order-block zones, Draw breaker boxes on chart). Stacked imbalance zones are tracked the same way (Draw imbalance zone boxes, off). Details: Structure zones.
Sessions
London (02:00 to 05:00) and New York (07:00 to 10:00) in New York time are on; Asia (20:00 to 00:00) is off. Each finished session's high and low stays as a dashed line until price trades through it. Optional boxes. Details: Sessions.
Context dashboard
Top right, 10 rows:
| Row | Example | Meaning |
|---|---|---|
AK FlowBook Lite | XAU/GC Intraday • IB 1 | Preset and data mode. OHLCV proxy (orange) means no intrabar data on the last bar. |
HTF trend (15) | Bullish | Last closed candle of the trend timeframe versus its EMA: Bullish, Bearish or Neutral. |
Structure | Bearish | Direction of the last structure break. |
MTF 15/60/240/D | ▲ ▲ ▼ ─ | Each timeframe's last closed candle versus its EMA. Green or red when at least two more agree one way. |
Location | At lower reference level | Also At upper reference level, At levels (both sides) or Between levels. |
Value position | Inside D value • above D VWAP | Price versus the day's value area and daily VWAP. |
PD zone / Session | Discount 23% / LDN | Premium/discount in the last swing range, and the active session (NY, LDN, ASIA, off-KZ). |
Naked ↑ / ↓ (n) | two prices | Nearest naked level above and below, and how many are stored. |
Δ~/Z • CVD~ (proxy) | 1.2K/1.4 • -3.5K | Bar delta estimate, its Z-score and CVD estimate. |
Education only | No signals • akorderflow.com | Reminder. |
"Lower reference level" includes the developing VAL, a naked level below, the prior POC from above, lower band 1 lines, prior lows, previous VWAPs from above, and active bullish FVG, order block, breaker or imbalance zones. "Upper" mirrors it.
Alerts
Lite has context alerts only. Create one TradingView alert on the chart and choose AKFB Lite, Any alert() function call. Turn on the events you want first; all are off by default.
Liquidity sweeps:AKFB Lite | Sweep of prior lows (context) | <ticker> | <TF>or... Sweep of prior highs (context) ...CHoCH (structure change):AKFB Lite | CHoCH up (structure change) | <ticker> | <TF>orCHoCH downNaked level touched:AKFB Lite | nPOC touched <price> | <ticker> | <TF>(alsonVAH,nVAL,nVWAP)
With Trigger alerts only on bar close on (default), each alert fires once at the bar close. TradingView keeps the settings an alert was created with, so recreate the alert after changing settings. More: Alerts.
Settings
Market preset other than Manual, the preset replaces Confirmed pivot length, Sweep lookback, Level touch tolerance (ATR), Delta proxy Z threshold and Big-volume proxy Z threshold. These are marked (preset) below.00: Quick Start / Display
| Setting | Default | What it does |
|---|---|---|
Market preset | XAU/GC Intraday | Balanced, XAU/GC Intraday, Crypto Intraday, Forex Intraday or Manual. |
Display mode | Clean | Clean hides PWH/PWL and PMH/PML, the band fill, Δ÷, IMB~ and chunk bubbles. Analysis adds them back except PMH/PML; Full shows everything. |
Confirm markers on bar close | On | Structure, sweep, SFP, Δ÷, EXH and bubble markers appear only on closed bars. |
Context dashboard | On | Shows the dashboard. |
00B: Right-Side Level Labels
| Setting | Default | What it does |
|---|---|---|
Show level names on chart right | On | Master switch. |
Right offset (bars) | 4 | Distance from the last bar. |
Include prices in labels | On | Adds prices. |
Use compact text | On | Small text. |
Current D/W/M VWAP | On | VWAP labels. |
Band 1 levels | Off | Band 1 labels. |
Previous D/W/M VWAP | On | PRE VWAP labels. |
Prior D/W/M high-low | On | Prior high and low labels. |
01: Auction Map (D/W/M)
| Setting | Default | What it does |
|---|---|---|
Daily VWAP / bands | On | Daily VWAP and bands. |
Weekly | On | Weekly VWAP and bands. |
Monthly | On | Monthly VWAP and bands. |
Show band 2 | On | 2σ bands. |
Previous D/W/M VWAP | On | Previous period's final VWAP. |
Prior D/W/M high-low | On | Prior day, week and month high and low. |
Band 1 sigma | 1.0 | Band 1 distance. |
Band 2 sigma | 2.0 | Band 2 distance. |
Level touch tolerance (ATR) | 0.18 (preset) | How close price must be for the dashboard to report "at a level" (also the D~ location filter). |
02: Structure & Liquidity
| Setting | Default | What it does |
|---|---|---|
Show structure markers | On | Master switch for BOS and CHoCH. |
BOS | Off | Break of structure labels. |
CHoCH | On | Change of character labels. |
Confirmed pivot length | 5 (preset) | Bars on each side that confirm a swing. |
Detect liquidity sweeps | On | Detects sweeps. |
Show sweep markers | On | Allows LQ markers. |
Sweep lookback | 20 (preset) | Bars back for the prior high or low. |
Sweep minimum volume Z | 0.80 | Volume a sweep needs. |
Sweep minimum wick (ATR) | 0.12 | Wick a sweep needs. |
Sweep reclaim depth | 0.25 | Close-back depth, as a share of the penetration. |
Sweep marker spacing | 6 | Minimum bars between LQ markers on one side. |
Enable FVG context | On | Tracks FVGs. |
Show FVG zones | Off | Draws FVG boxes. |
Minimum FVG (ATR) | 0.12 | Smallest gap. |
Enable structure order blocks | On | Tracks order blocks. |
Show order-block zones | Off | Draws OB boxes. |
OB source search | 12 | Bars searched for the OB candle. |
Zone maximum life (bars) | 250 | Age limit for FVGs and OBs. |
03: Volume / Order-Flow Proxies (~)
| Setting | Default | What it does |
|---|---|---|
Show proxy events | On | Master switch for flow markers. |
Proxy normalization length | 50 | Bars used to judge what is unusual. |
Delta proxy Z threshold | 1.35 (preset) | Delta event threshold. |
D~ display minimum absolute Z | 2.10 | Display threshold for D~ (the min Z field in group 14 also applies). |
D~ marker spacing | 5 | Minimum bars between D~ markers. |
D~ display near a level only | On | D~ only at levels and zones. |
Big-volume proxy Z threshold | 2.0 (preset) | BV~ threshold. |
Absorption volume Z | 1.4 | Volume A~ needs. |
Max body/range | 0.30 | Largest body for A~. |
CVD proxy divergence | On | Detects CVD~. |
CVD divergence pivot | 5 | Swing length for CVD~ and Δ÷. |
Show SFP events | On | Allows SFP labels. |
SFP minimum wick (ATR) | 0.20 | Wick an SFP needs. |
SFP minimum volume Z | 0.70 | Volume an SFP needs. |
04: Context Bias
| Setting | Default | What it does |
|---|---|---|
Trend timeframe | 15 | Timeframe of the HTF trend row. |
HTF EMA length | 50 | EMA length for the HTF trend and MTF arrows. |
07: Context Alerts
| Setting | Default | What it does |
|---|---|---|
Enable context alerts | On | Master switch for Lite alerts. |
Liquidity sweeps | Off | Sweep alerts. |
CHoCH (structure change) | Off | CHoCH alerts. |
Naked level touched | Off | Naked level touch alerts. |
Trigger alerts only on bar close | On | Once per bar at the close. |
08: Intrabar Volume-Flow Proxy
| Setting | Default | What it does |
|---|---|---|
Intrabar timeframe | Auto | Auto uses 1-minute intrabars on charts up to 1 hour. |
Manual intrabar TF | 1 | Intrabar timeframe when Manual. |
Footprint bin size | Auto (ATR) | Row sizing: Auto (ATR) or Manual ticks. |
Manual ticks per bin | 4 | Row height in ticks. |
Auto bin size (ATR fraction) | 0.08 | Row height as a fraction of ATR. |
CVD anchor (dashboard) | Session | Session resets CVD each trading day; Continuous never resets. |
08B: Large Intrabar Volume Chunks (~)
| Setting | Default | What it does |
|---|---|---|
Show large-volume chunk bubbles | On | Detects large chunks (bubbles hidden in Clean). |
Max bubbles per bar | 3 | Maximum bubbles per bar. |
08C: Imbalance / Exhaustion (~)
| Setting | Default | What it does |
|---|---|---|
Detect stacked imbalance zones | On | Finds imbalance zones. |
Draw imbalance zone boxes | Off | Draws the zones as boxes. |
Imbalance ratio (up:down volume) | 3.0 | Ratio one side needs (also panel arrows). |
Stacked bins required | 3 | Neighboring rows needed. |
Min bin volume (% of bar) | 4.0 | Smallest row share that counts. |
Zone max life (bars) | 200 | Age limit. |
Max active zones | 10 | Maximum zones. |
Absorption edge volume % | 30.0 | Volume share at one end of the bar for A~. |
Show exhaustion markers | On | Allows EXH. |
Exhaustion breakout lookback | 12 | Bars back for the new high or low. |
09: Volume Profile
| Setting | Default | What it does |
|---|---|---|
Show session volume profile | On | Right-edge developing and prior levels (calendar D/W/M). |
Histogram rows (volume bars) | Off | Draws the histogram. |
Rendered profile period | Day | Profile drawn at the right edge. |
Show D/W/M POC-VAH-VAL registry | On | Nine D/W/M lines and labels. |
Max profile rows | 36 | Maximum histogram rows. |
Value area % | 70.0 | Value area share. |
Profile width (bars) | 22 | Profile width. |
Profile right offset (bars) | 8 | Gap from the last bar. |
Show prior POC / VAH / VAL lines | On | Prior period lines. |
10: FlowBook Panel
| Setting | Default | What it does |
|---|---|---|
Show developing-bar footprint panel | On | Shows the panel. |
Panel rows | 12 | Maximum rows. |
Panel position | Right | Right or Left. |
11: Naked Levels & Delta Divergence
| Setting | Default | What it does |
|---|---|---|
Track naked (untested) levels | On | Stores and draws naked levels. |
Include naked VAH / VAL | On | Adds nVAH, nVAL. |
Include naked prior VWAP closes | On | Adds nVWAP. |
Max naked levels kept | 18 | Maximum stored. |
Naked level max life (bars) | 1500 | Age limit. |
Show naked level labels | On | Level names. |
Directional-volume proxy divergence | On | Detects Δ÷. |
Swing delta length (bars) | 8 | Bars of delta summed for Δ÷. |
14: Event Markers (per-event on/off)
| Setting | Default | What it does |
|---|---|---|
Δ Delta marker (D~) | On | D~ markers. |
▪ Big volume (BV~) | Off | BV~ markers. |
◆ Absorption (A~) | On | A~ markers. |
CVD~ divergence | On | CVD~ markers. |
Δ÷ directional-volume divergence | On | Δ÷ labels (hidden in Clean). |
● Large intrabar-volume chunks | On | Bubbles (hidden in Clean). |
× avg vol | 2.5 | Chunk size threshold, as a multiple of average intrabar volume. |
IMB~ stacked imbalance | On | IMB~ markers (hidden in Clean). |
EXH exhaustion | Off | EXH labels. |
LQ Liquidity sweeps | On | LQ markers. |
SFP swing failure | Off | SFP labels. |
The field next to the delta switch is titled min |Z| (default 2.1). It is a second display threshold for D~; the higher of it and D~ display minimum absolute Z wins.
15: MTF Dashboard
| Setting | Default | What it does |
|---|---|---|
TF 1, TF 2, TF 3, TF 4 | 15, 60, 240, D | MTF arrow timeframes. |
16: Liquidity Pools / Breakers
| Setting | Default | What it does |
|---|---|---|
Detect EQH / EQL liquidity pools | On | Draws EQH/EQL. |
Equal H/L tolerance (ATR) | 0.15 | How close two swings must be. |
Track breaker blocks (failed OBs) | On | Tracks breakers for the dashboard location row. |
Draw breaker boxes on chart | Off | Draws BRK+/BRK− boxes. |
17: Sessions / Killzones
| Setting | Default | What it does |
|---|---|---|
Show killzone boxes | Off | Session boxes. |
Session H/L lines until swept | On | Session high and low lines. |
Timezone | America/New_York | Time zone of the windows. |
Asia and its time field | Off, 2000-0000 | Asia window. |
London and its time field | On, 0200-0500 | London window. |
New York and its time field | On, 0700-1000 | New York window. |
Lite or Full?
Lite covers the full context map. Full adds setup context markers, FlowBook X, the 15-minute liquidity layer, Ichimoku and the 3-Drive pattern zone; Lite has BOS/CHoCH markers and the IMB~ marker, which Full does not. See the comparison table. The other pages of these docs describe Full; where Lite differs, this page is the reference.
Education only. Not financial advice. Trading futures and CFDs carries a high risk of loss.