Documentation menu
VWAP map: daily, weekly and monthly VWAP
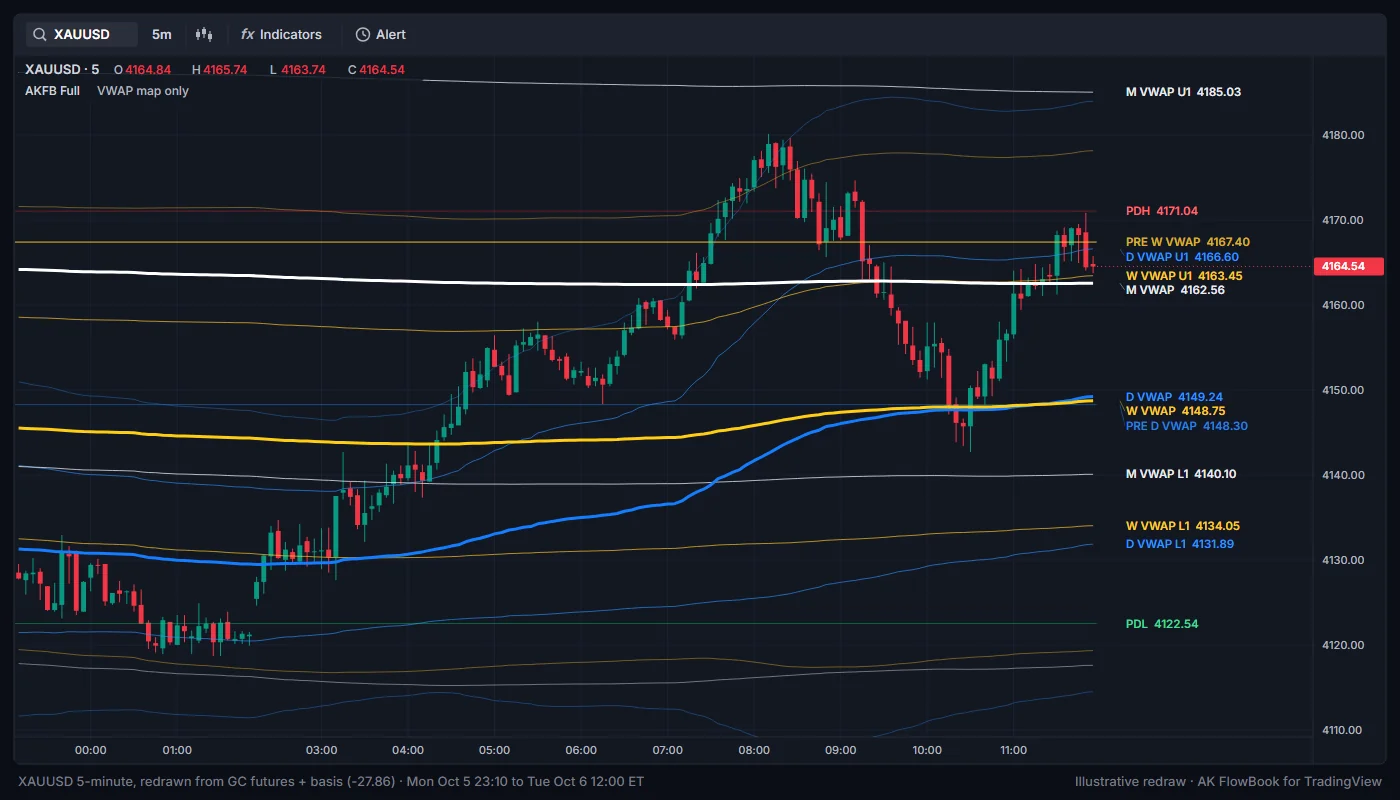
The VWAP map is the base layer of AK FlowBook. It shows the volume-weighted average price for the current day, week and month, how far price has stretched from it, and where the previous periods ended. Most other components refer back to these levels.
What VWAP is
VWAP (volume-weighted average price) is the average price of the period, weighted by how much volume traded at each price. AK FlowBook uses each bar's typical price (high + low + close, divided by 3) and the bar's volume. Each VWAP starts fresh at the beginning of a new day, week or month, following the chart symbol's own trading sessions on TradingView.
The bands show the volume-weighted standard deviation (σ) around VWAP. Band 1 sits 1σ away and band 2 sits 2σ away by default.
What is drawn
| Line | Color | Notes |
|---|---|---|
D VWAP | Blue, thick | Daily VWAP. |
| Daily band 1 (upper and lower) | Light blue | A shaded fill between them in Analysis and Full display modes. |
| Daily band 2 | Fainter light blue | Needs Show band 2. |
W VWAP and its bands | Gold | Weekly. |
M VWAP and its bands | White | Monthly. |
Prev D VWAP, Prev W VWAP, Prev M VWAP | Faded blue, gold and white step lines | The final VWAP of the previous day, week and month. |
PDH, PDL | Red, green step lines | Prior day high and low. |
PWH, PWL | Red, green | Prior week high and low. Hidden in Clean display mode. |
PMH, PML | Red, green | Prior month high and low. Full display mode only. |
The prior day, week and month highs and lows come from closed higher-timeframe bars, so they do not change during the current period.
Right-side labels
At the right edge of the chart, each level gets a name and, by default, its price. The names are:
D VWAP,W VWAP,M VWAPD VWAP U1,D VWAP L1,W VWAP U1,W VWAP L1,M VWAP U1,M VWAP L1(band 1 upper and lower)PRE D VWAP,PRE W VWAP,PRE M VWAP(previous period's VWAP)PDH,PDL, plusPWH,PWL(not in Clean) andPMH,PML(Full only)D POC,D VAH,D VALand the weekly and monthly equivalents (see Volume profiles)
Band 2 levels are not labelled. When several levels sit close together, their labels can overlap. Turn off Band 1 levels or Include prices in labels to reduce clutter.
How to read it
- Location first. Above or below
D VWAPtells you which side of the day's average price the market is trading on. The weekly and monthly VWAP give the same answer on a larger scale. - Distance. Band 1 and band 2 show how stretched price is from the average. A move to band 2 is a larger stretch than a move to band 1. That is a description of distance, not a forecast.
- Previous VWAP. The previous period's final VWAP is a reference many traders watch when price returns to it.
- Prior highs and lows.
PDH/PDLand the weekly and monthly extremes mark where the last period found its edges. Trade beyond them means price is exploring new territory. - Clusters. When several levels from different periods sit together, that area carries more references at once. The setup engine counts such clusters (see Setup context).
CFD and futures charts
Period boundaries and volume come from the chart symbol. An XAUUSD CFD and GC futures use different sessions and different volume, so their VWAPs and prior highs and lows differ, and futures trade at a different price level (the basis). See Futures levels on a CFD chart.
Settings
| Setting | Default | What it does |
|---|---|---|
Daily VWAP / bands | On | Shows the daily VWAP and its bands. |
Weekly | On | Shows the weekly VWAP and its bands. |
Monthly | On | Shows the monthly VWAP and its bands. |
Show band 2 | On | Shows the 2σ bands for each period that is on. |
Previous D/W/M VWAP line | On | Shows the previous period's final VWAP. |
Prior D/W/M high-low | On | Shows prior day, week and month high and low (subject to Display mode). |
Band 1 sigma | 1.0 | Distance of band 1 in standard deviations. |
Band 2 sigma | 2.0 | Distance of band 2 in standard deviations. |
The right-side label switches (Show level names on chart right, Right offset (bars), Include prices in labels, Use compact text, Current D/W/M VWAP, Band 1 levels, Previous D/W/M VWAP, Prior D/W/M high-low) are listed in the Settings reference.
Education only. Not financial advice. Trading futures and CFDs carries a high risk of loss.