Documentation menu
Guide: replay of the Oct 7 gold drop
The map firstThe morning: takes without follow-through12:29: LQ-S* on the 1-minute chartThe break and the reboundEvery label of the day, and what came nextWhat to take from itNotes on this replay
On Wednesday, October 7, 2026, gold fell about $58 in 31 minutes: XAUUSD went from 4123.3 at 13:20 London to 4065.2 at 13:51. This guide replays the day with AK FlowBook Full, step by step: the map before the move, the liquidity layer, the LQ-S* label, the break, and what price did after every label of the day. The goal is to practice reading context, not to judge labels as right or wrong.
AK FlowBook for TradingView is built for traders who do not have a full volume-trading setup: no powerful PC, no multi-monitor desk, no professional platform with a paid futures data feed. It brings futures-derived levels and order-flow context to the chart you already use, on any broker's XAUUSD chart, even on a laptop or a phone. If you want exact order flow (real delta, big trades, icebergs, the order book order by order), see AK FlowBook for NinjaTrader.
How the charts were made: redrawn from our gold futures (GC) 1-minute data, with every layer recomputed the way the public Full build computes it, and shown as XAUUSD = GC − 26.0 (the basis we measured that day). Times are London time (UTC+1). Take marks (x HH:mm) are in UTC, as on the indicator. Your own XAUUSD chart can show slightly different prices and marks; see the notes at the end.
The map first
Before the drop, at 13:20 London, the 5-minute chart looked like this:
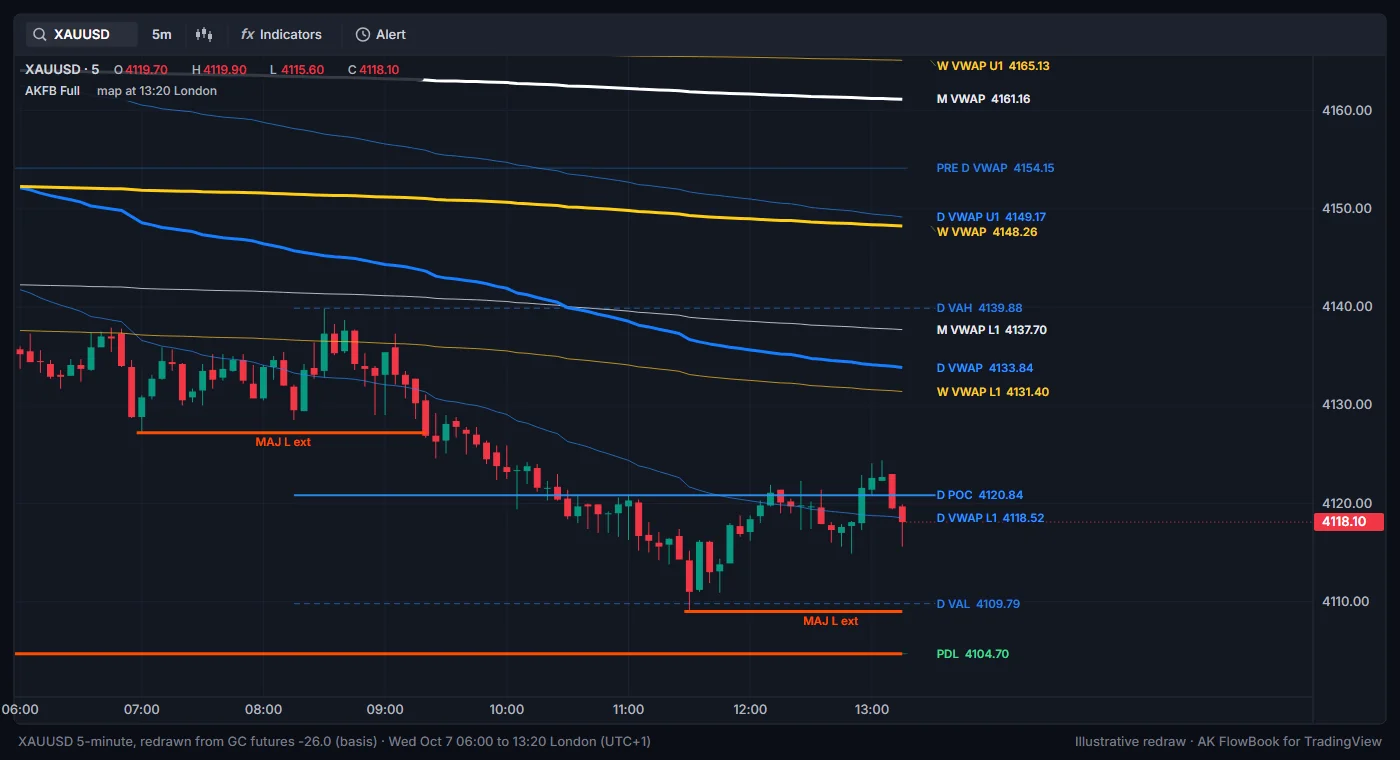
| Level | XAUUSD | GC |
|---|---|---|
M VWAP | 4161.2 | 4187.2 |
PRE D VWAP | 4154.1 | 4180.1 |
D VWAP U1 | 4149.2 | 4175.2 |
W VWAP | 4148.3 | 4174.3 |
D VAH | 4139.9 | 4165.9 |
D VWAP | 4133.8 | 4159.8 |
D POC | 4120.8 | 4146.8 |
D VWAP L1 | 4118.5 | 4144.5 |
| Price at 13:20 | 4118.1 | 4144.1 |
D VAL | 4109.8 | 4135.8 |
MAJ L (15-minute) | 4109.0 | 4135.0 |
PDL (also a 15-minute MAJ L) | 4104.7 | 4130.7 |
Price sat under the day's VWAP, just above the D POC and the lower VWAP band. Under it, three references sat within about $5 of each other: the 15-minute MAJ L at 4109.0, the developing D VAL at 4109.8 and the prior day low at 4104.7. A cluster like that is a place many traders watch. See VWAP map, Volume profiles and Liquidity.
The morning: takes without follow-through
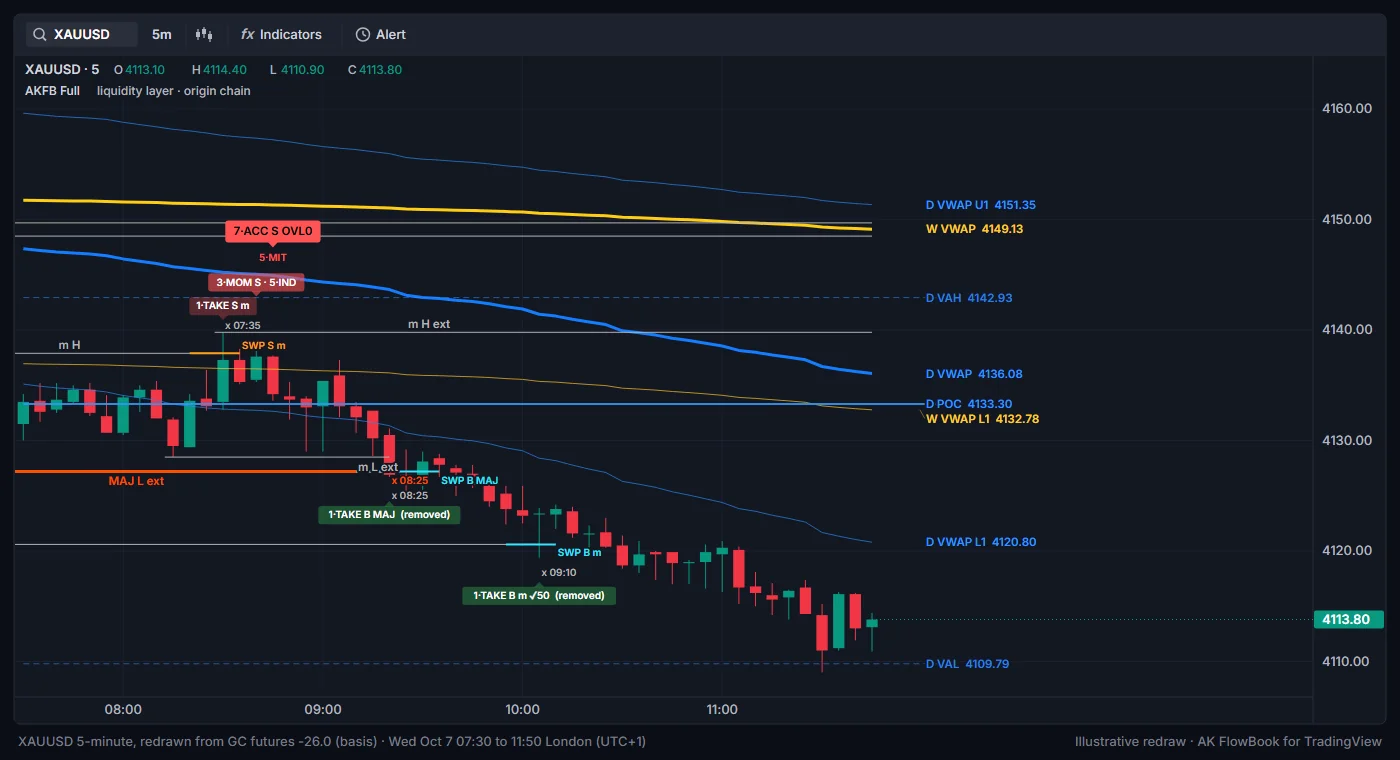
- 08:30 to 08:45: a 15-minute
m Hwas taken and price closed back below it (SWP S m). The origin chain ran1·TAKE S m,3·MOM S · 5·IND,5·MITand7·ACC S OVL0, just under the weekly and monthly value area lows (about 4139), at 4134. Over the next two hours price drifted to 4117, and to 4109 by 11:30. - 09:20 and 10:05: lows near the day's value area low were taken (
1·TAKE B MAJ, then1·TAKE B m ✓50). A chain needs a strong closed 5-minute candle within three candles. None came, so each chain failed and itsTAKElabel was removed from the chart. They are drawn faint here only to show where they were.
A removed TAKE label is information too: liquidity was taken, and nothing decisive followed. See Liquidity sequences.
12:29: LQ-S* on the 1-minute chart
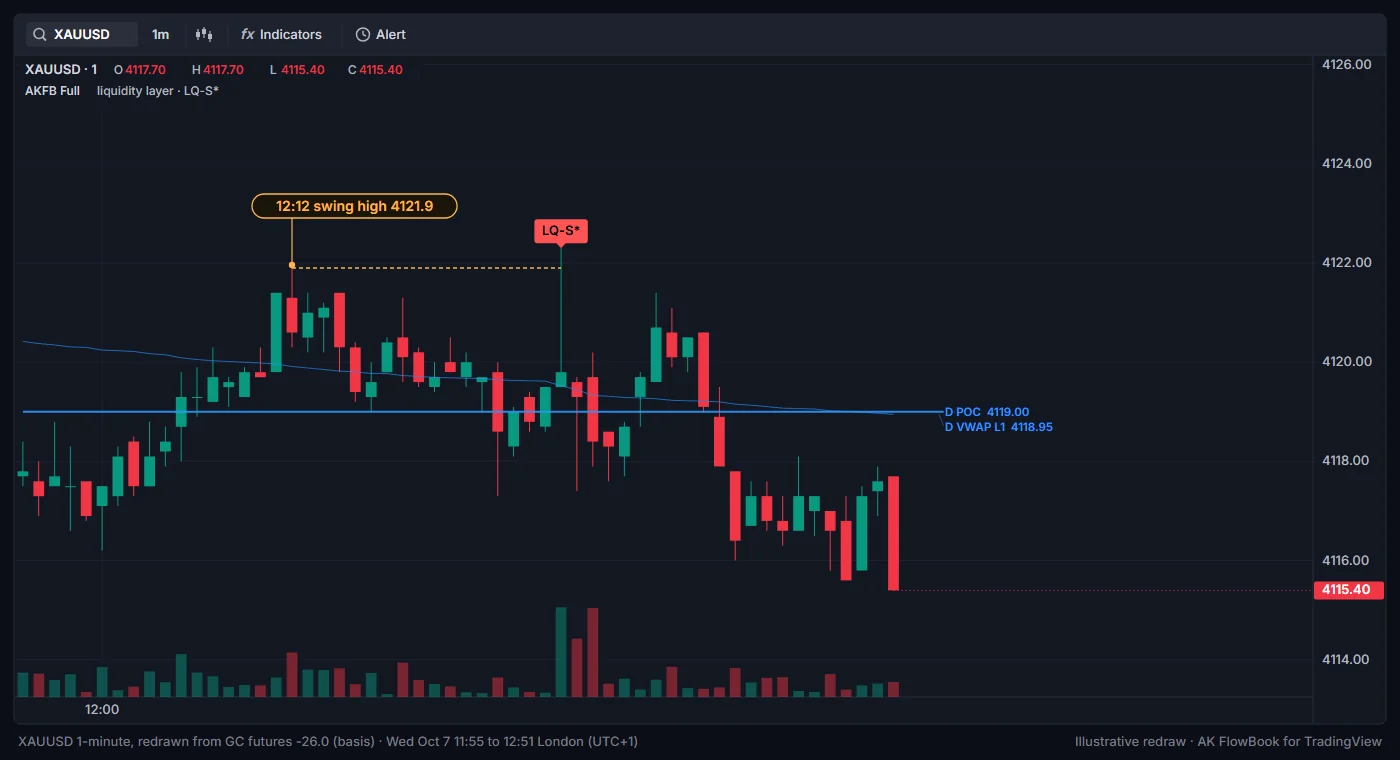
In plain words, the LQ-S* label said:
- A high was taken. Price traded above the 12:12 swing high (4121.9) and the bar closed back below it.
- With big volume. That bar traded 372 contracts, about 4 times the average of the previous 60 bars.
- And the
*: the recent chart swings already leaned the same way, down.
Location: under the D VWAP (4135), at the lower VWAP band and the D POC, above the 4105 to 4110 cluster. The label printed on the 1-minute chart only; on the 5-minute chart the same minute's volume was part of a larger bar and did not reach the threshold. See 1-minute or 5-minute?.
The break and the rebound
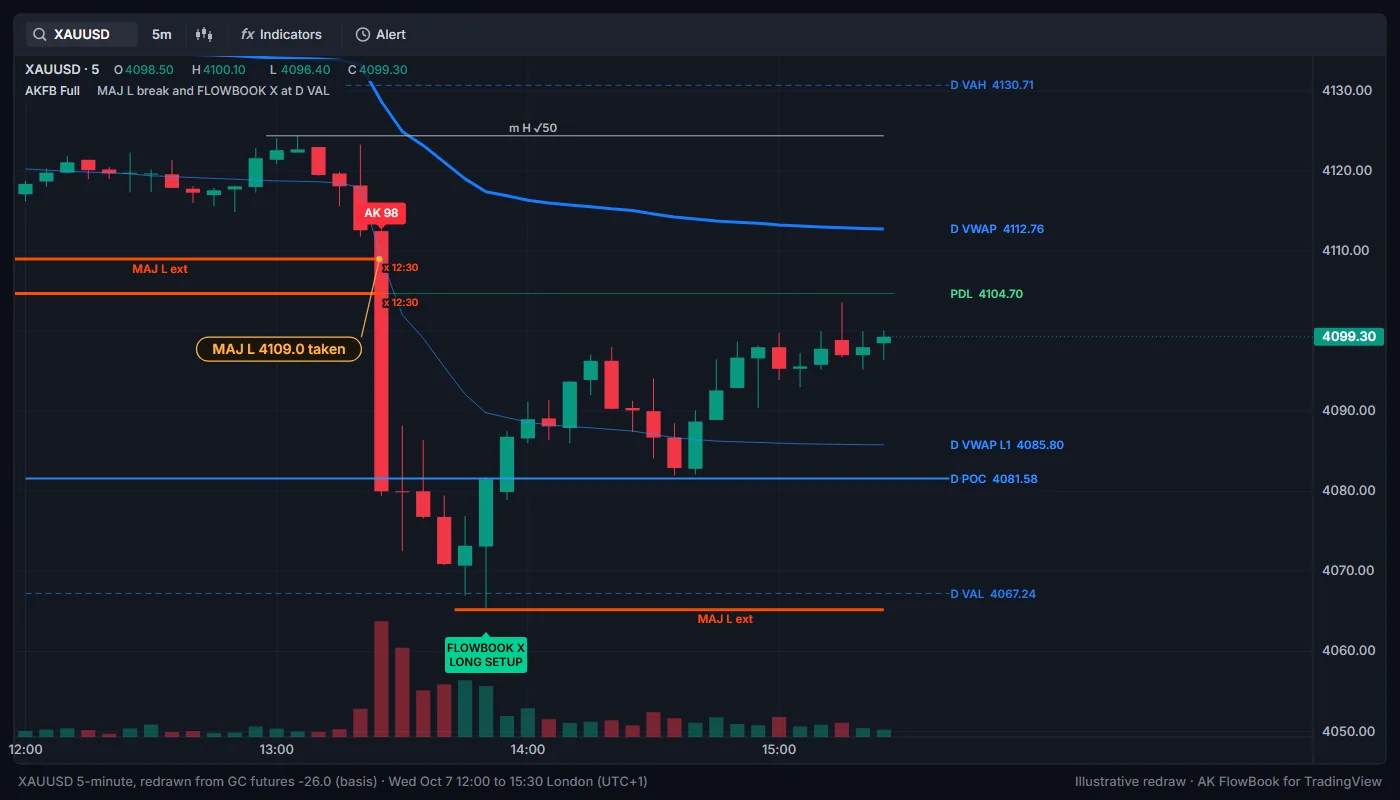
- A small push up first: price reached 4124.4 at 13:06, then eased back.
- 13:25: price traded through the
MAJ L, theD VALand thePDL. BothMAJ Llines show their take marks (x 12:30, UTC). That 5-minute bar traded 7,144 contracts, about 14 times its 60-bar average. On the 1-minute chart, the 13:26 bar alone traded 2,254 contracts, against an average of about 95 per minute from 11:00 to 13:20. - 13:51: the low, 4065.2, near where the day's value area low ended the session (4067.2). On the 13:50 bar the 5-minute chart printed
FLOWBOOK X, long-side context atD VAL. A newMAJ Llater formed at that low. - Afterwards: price rebounded to 4103.6 by 15:18 and stood near 4099 at 15:30.
The AK 98 label on the 13:25 bar is short-side setup context printed at the close of the break bar, at the prior day's POC. See Setup context and FlowBook X.
Every label of the day, and what came next
From the start of the trading day (23:00 London on Oct 6) to 15:30 London: every label the 5-minute chart kept on screen with default settings (Elite mode shows tier A+ setup labels), plus the two removed morning TAKE labels and the 1-minute LQ-S* from above. Other TAKE labels that were removed (in the night session and at 13:25) are left out.
| London | Label | Chart | Where | What came next |
|---|---|---|---|---|
| 01:10 | AK 86 | 5m | Long-side context at D VWAP L1, 4171 | Price fell to 4141 within two hours. |
| 02:50 | AK 100 | 5m | Short-side context at PRE D VWAP, 4148 | Price ranged 4138 to 4150 for two hours. |
| 08:45 | 7·ACC S OVL0 | 5m | After a high was taken at 08:30, near the W and M value area lows, 4134 | Price drifted to 4117 within two hours, 4109 by 11:30. |
| 09:20, 10:05 | 1·TAKE B | 5m | Lows taken near D VAL | No strong candle; labels removed; price kept sliding. |
| 12:29 | LQ-S* | 1m | High swept with about 4x volume, 4122 | A push to 4124, then the 13:25 break and 4065 at 13:51. |
| 13:25 | AK 98 | 5m | Short-side context on the break bar, close 4080 | Low 4065 at 13:51, then back to 4099 by 15:30. |
| 13:50 | FLOWBOOK X | 5m | Long-side context at D VAL, low 4065 | Rebounded to 4104 by 15:18. |
This is history, not a scorecard. Some labels were followed by a move in their direction, some were not.
What to take from it
- A label is not a forecast.
LQ-S*,TAKE,ACC,AKandFLOWBOOK Xdescribe what already happened on closed bars: where liquidity was taken and how price responded. - Location gives a label weight. The
LQ-S*printed under the day's VWAP and above a cluster of three references. The morning takes printed in the middle of a slow drift. - Price at the level decides. The morning takes got no strong candle. The 13:25 break came with about 14 times normal volume. Watch what price does at the level, not only what the label says.
Notes on this replay
- Futures data, CFD prices. The charts are built from GC futures volume and shifted by the measured basis. On a broker's XAUUSD chart the volume is the broker's, so VWAPs, value areas, 15-minute swings and
LQlabels can differ. See Futures levels on an XAUUSD CFD chart. - Two timeframes. The
AKsetup labels and the dashboard's setup context run on XAUUSD/GC 5-minute charts by default. The liquidity layer runs on 1- to 5-minute charts. See 1-minute or 5-minute? and Dashboard. - Redrawn, not a screenshot. Marks are what our recomputation of the public build produces from futures data. Small differences from a live TradingView chart are expected.
Related: Liquidity, Liquidity sequences, Setup context, FlowBook X, Dashboard.
Education only. Not financial advice. Trading futures and CFDs carries a high risk of loss.