Documentation menu
1-minute or 5-minute? Choosing a timeframe
What runs whereThe 1-minute chart: detail at a levelThe 5-minute chart: the day on one screenHow traders use them
AK FlowBook Full runs on any intraday chart, but some layers depend on the timeframe. This page explains what changes between a 1-minute and a 5-minute gold chart, using the same session (the Oct 7, 2026 drop) on both, and how traders often combine the two.
AK FlowBook for TradingView is built for traders who do not have a full volume-trading setup: no powerful PC, no multi-monitor desk, no professional platform with a paid futures data feed. It brings futures-derived levels and order-flow context to the chart you already use, on any broker's XAUUSD chart, even on a laptop or a phone. If you want exact order flow (real delta, big trades, icebergs, the order book order by order), see AK FlowBook for NinjaTrader.
What runs where
| Layer | 1-minute chart | 5-minute chart |
|---|---|---|
| Map: VWAPs, profiles, naked levels, sessions | Yes | Yes |
15-minute liquidity layer (levels, take marks, SWP) | Yes (runs on 1 to 5 minutes) | Yes |
LQ-S* / LQ-B* | Yes, on 1-minute bars and 1-minute volume | Yes, on 5-minute bars and volume |
Origin chain (TAKE, MOM, MIT, ACC) | Yes; the momentum step reads closed 5-minute candles | Yes |
Setup context (AK labels, dashboard Setup context) | Not drawn by default; the dashboard header shows CHECK XAU/GC • 5m | Yes, the default scope for XAUUSD and GC |
LQ, SFP, Δ÷, EXH and volume bubbles | Hidden while Limit setup markers to XAU/GC 5-minute is on | Shown when switched on |
FLOWBOOK X | Yes; with Universal auto its sensitivity follows the timeframe | Yes |
Flow estimates (~) | 1-minute intrabars (one per bar) | 1-minute intrabars (five per bar) |
Above 5 minutes the liquidity layer draws nothing, and above 1 hour the flow estimates use coarser intrabars. See Liquidity, Setup context, FlowBook X and Intrabar flow estimates.
The 1-minute chart: detail at a level
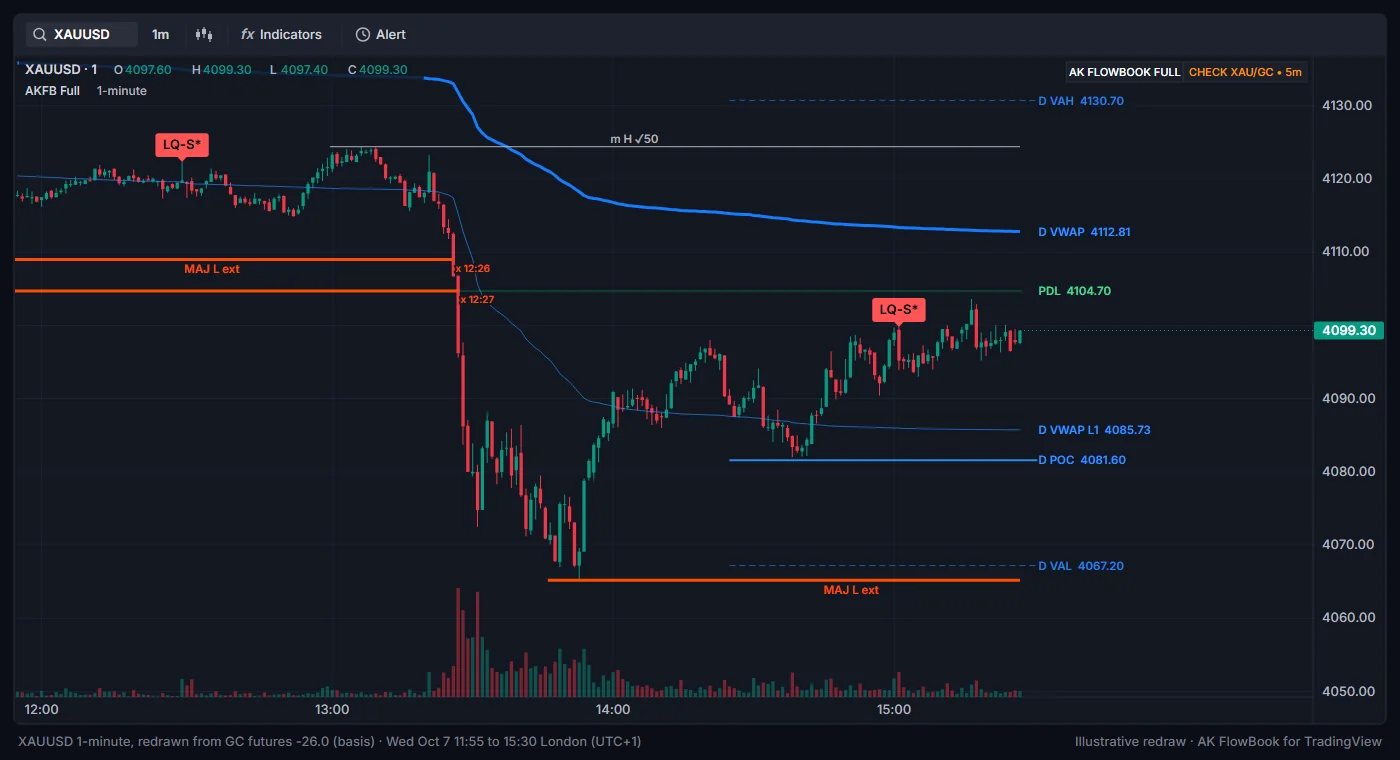
- More marks. From the start of the trading day to 15:30 London, the 1-minute chart printed 8
LQ-S*/LQ-B*labels; the 5-minute chart printed none. Each is a sweep with a big volume bar, measured against the previous 60 bars, which on 1 minute is the last hour. - One minute of volume per bar. The 12:29 sweep bar traded 372 contracts, about 4 times the 1-minute average. Inside its 5-minute bar that burst was diluted and did not reach the threshold.
- The minute a level breaks. The
MAJ Lat 4109 was taken by the 1-minute bar that closed at 13:26 London (take markx 12:26, in UTC), and the next bar alone traded 2,254 contracts. - No setup labels. The header reads
CHECK XAU/GC • 5m: the setup engine keeps calculating, butAKlabels are not drawn whileLimit setup markers to XAU/GC 5-minuteis on (the default).
The 5-minute chart: the day on one screen
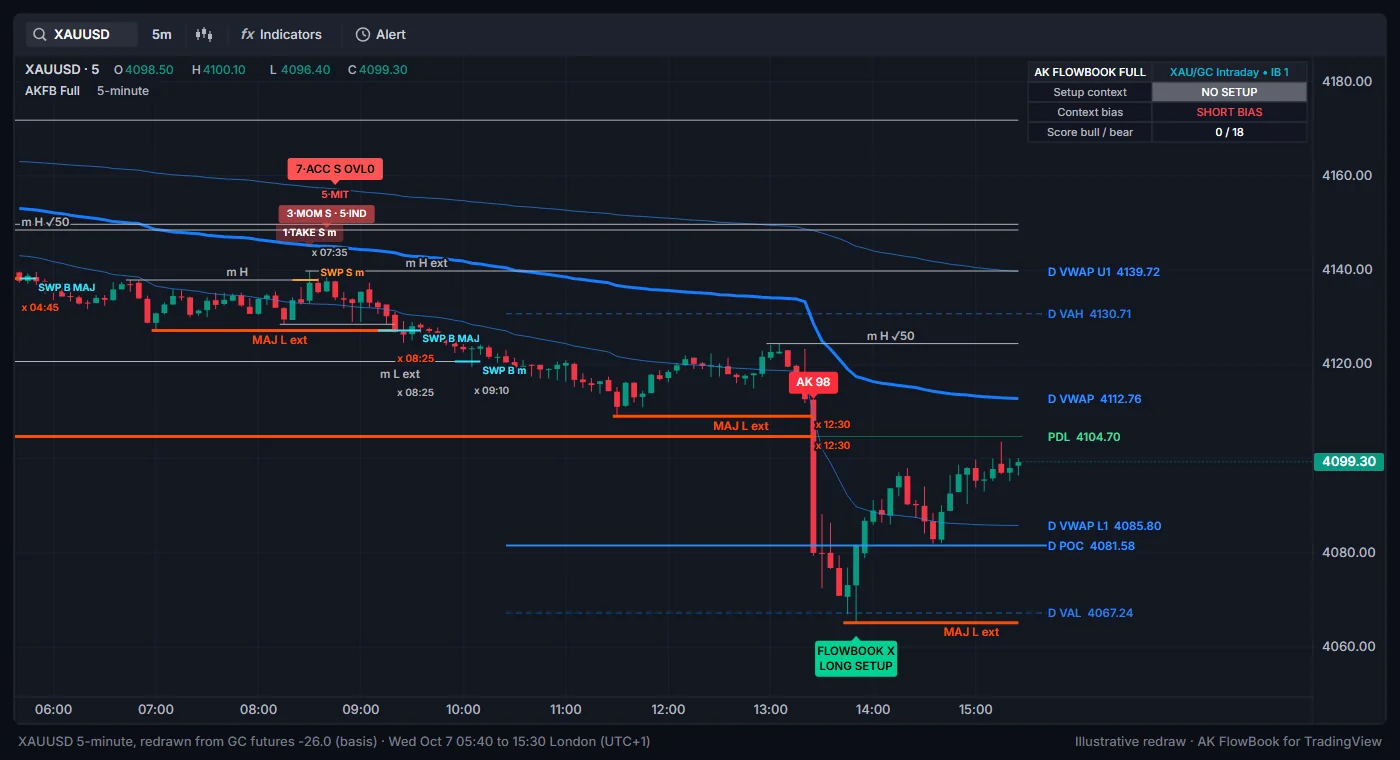
- Fewer, larger bars. The day from 23:00 to 15:30 London is 198 bars instead of 981, so structure, VWAPs and value areas are easier to read in one view.
- The setup engine runs here.
AKlabels and the dashboard'sSetup contextrow belong to the XAUUSD/GC 5-minute chart by default, and the header shows the preset and the intrabar mode, for exampleXAU/GC Intraday • IB 1. See Dashboard. - The chain looks almost the same. The origin chain reads closed 5-minute candles on both timeframes, so the morning chain (
1·TAKE S mto7·ACC S OVL0) appeared within a few minutes of each other on the two charts.
How traders use them
| Task | Timeframe |
|---|---|
| Build the map before the session: VWAPs, value areas, naked levels, 15-minute levels | 5-minute |
Read setup context and FLOWBOOK X | 5-minute (the default scope) |
| Watch what price does when it reaches a level: the sweep, the close back, the volume burst | 1-minute |
| Review the day afterwards | 5-minute first, 1-minute for the key moments |
Many traders keep both: a 5-minute chart for the day and the context, and a second 1-minute pane to watch the level. A shorter timeframe shows more detail and more noise; it does not make a label more reliable. Neither timeframe turns a label into a prediction. For a full walk-through of the same session, see Guide: replay of the Oct 7 gold drop.
Related: Liquidity, Liquidity sequences, Setup context, FlowBook X, Dashboard, Troubleshooting.
Education only. Not financial advice. Trading futures and CFDs carries a high risk of loss.